<?xml version="1.0" encoding="utf-8"?><feed xmlns="http://www.w3.org/2005/Atom" ><generator uri="https://jekyllrb.com/" version="3.10.0">Jekyll</generator><link href="https://unravelweb.dev/feed.xml" rel="self" type="application/atom+xml" /><link href="https://unravelweb.dev/" rel="alternate" type="text/html" /><updated>2026-11-04T11:28:30+00:00</updated><id>https://unravelweb.dev/feed.xml</id><title type="html">Nishu Goel</title><subtitle>Product Engineer @epilot, Web Google Developer Expert, Microsoft MVP</subtitle><entry><title type="html">til: TF plugin cache</title><link href="https://unravelweb.dev/2024/04/01/til-tf-plugin-cache/" rel="alternate" type="text/html" title="til: TF plugin cache" /><published>2024-04-01T00:00:00+00:00</published><updated>2024-04-01T00:00:00+00:00</updated><id>https://unravelweb.dev/2024/04/01/til-tf-plugin-cache</id><content type="html" xml:base="https://unravelweb.dev/2024/04/01/til-tf-plugin-cache/"><![CDATA[<p>Writing a tool at work to move our infrastructure setup to a more declarative approach. To do so, I run terraform inside AWS Lambda (will write about this some time), every time a configuration needs to be applied.</p>
<p>I use the terraform <code class="language-plaintext highlighter-rouge">import</code> feature to copy configurations from test accounts, and need to do so for all dependencies of one resource being “imported”, to avoid missing configs. <br />
Since this happens iteratively, running <code class="language-plaintext highlighter-rouge">terraform init</code> every run to get the providers installed was a bad idea since 1) redundant 2) less efficient.</p>

<p><strong><em>Plugin Cache Dir</em></strong></p>

<p><code class="language-plaintext highlighter-rouge">terraform init</code> was maintaining separate copies of the plugins and were being downloaded for each configuration.</p>

<p>Terraform optionally allows the use of a local directory as a shared plugin cache which can be used as the central plugins directory, thus avoiding downloading the plugins every time.</p>

<p>To enable the plugin cache, use the <code class="language-plaintext highlighter-rouge">plugin_cache_dir</code> setting in the CLI configuration file <code class="language-plaintext highlighter-rouge">.terraformrc</code>. For example:</p>

<div class="language-plaintext highlighter-rouge"><div class="highlight"><pre class="highlight"><code>plugin_cache_dir = "$HOME/.terraform.d/plugin-cache"
</code></pre></div></div>

<p>The plugin-cache directory needs to be created already since the <code class="language-plaintext highlighter-rouge">init</code> command will not create it if not found. Terraform will then use. the installed plugins from this directory if present already, and install in the plugin cache if the directory is empty</p>

<p>OR</p>

<div class="language-plaintext highlighter-rouge"><div class="highlight"><pre class="highlight"><code>terraform init -plugin-dir=$HOME/.terraform.d/plugin-cache
</code></pre></div></div>

<p><strong><em>FileSystem Mirror configuration</em></strong></p>

<p>We could also use a <em>filesystem mirror</em> method to explicitly install plugins using a local directory with the option to include/exclude specific providers.</p>

<div class="language-plaintext highlighter-rouge"><div class="highlight"><pre class="highlight"><code>provider_installation {
  filesystem_mirror {
    path    = "/usr/terraform.d/providers"
    include = ["example.com/*/*"]
  }
  direct {
    exclude = ["example.com/*/*"]
  }
}
</code></pre></div></div>

<p>Both worked well for the above case, with plugin cache being a straightforward approach 👍</p>]]></content><author><name></name></author><category term="Node.js" /><category term="Terraform" /><category term="Uncategorized" /><category term="javascript" /><category term="terraform" /><summary type="html"><![CDATA[Writing a tool at work to move our infrastructure setup to a more declarative approach. To do so, I run terraform inside AWS Lambda (will write about this some time), every time a configuration needs to be applied.]]></summary></entry><entry><title type="html">The ü/ü Conundrum</title><link href="https://unravelweb.dev/2024/02/12/the-u-u-conundrum/" rel="alternate" type="text/html" title="The ü/ü Conundrum" /><published>2024-02-12T00:00:00+00:00</published><updated>2024-02-12T00:00:00+00:00</updated><id>https://unravelweb.dev/2024/02/12/the-u-u-conundrum</id><content type="html" xml:base="https://unravelweb.dev/2024/02/12/the-u-u-conundrum/"><![CDATA[<p>I implemented search and filtering for entities on our product at epilot. The users were heavily using the feature, however, a unique issue surfaced: difficulties in filtering file names containing diacritical marks like umlauts (<code class="language-plaintext highlighter-rouge">Äpfel</code>, <code class="language-plaintext highlighter-rouge">über</code>, <code class="language-plaintext highlighter-rouge">schön</code>, etc.).</p>

<p>Intrigued, I delved into the logic to investigate. Initially, everything seemed in order. For instance, a file named “blöb” was saved precisely as “blöb” — no bizarre encoding alterations were apparent.</p>

<p>Can you spot any difference between “blöb” and “blöb”?</p>

<p>This time instead of typing the word in the search bar, I copied it from the uploaded and saved filename, and and voilà, the search functioned perfectly! 🤯. This definitely meant the file name was subtly altered upon upload, hinting at a background encoding transformation.</p>

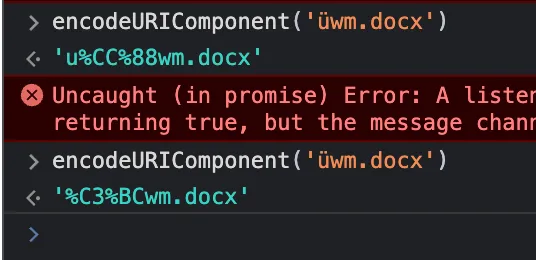
<p>So, as anyone would, I employed the power of <code class="language-plaintext highlighter-rouge">encodeURIComponent</code> to see for myself what really was different.</p>

<p>There it was! The different types of encoding forms that led to this. Now you might be wondering (<em>I was wondering too!</em>):</p>

<p><em>As if worrying about encoding wasn’t enough, now we’ve got to stress over its different types too 🤦‍♀ and wait, its 2024, and we are still grappling with Unicode character encoding problems?</em></p>

<p><img src="/assets/img/5f7a1d-image.png" alt="" /></p>

<p>The culprits in this case were these two contrasting encoding types: <code class="language-plaintext highlighter-rouge">%C3%BC</code> and <code class="language-plaintext highlighter-rouge">%CC%88</code>, leading to the search malfunction. This is a well-known issue with NFD/NFC encoding forms.<br />
There is a detailed explanation <a href="https://unicode.org/reports/tr15/#Norm_Forms">here</a>.</p>

<p><img src="/assets/img/ad3628-10kVUt4jpUmk_aS0qk0riPA.png" alt="" /></p>

<p><em>Now imagine explaining this technical jargon to a user!</em>😃</p>

<p>To fix it, I aligned the encoding type of the searched filename with that of the saved filename.<br />
On <strong>MacOS</strong>, the encoding was NFD (for ö: 111 + 776), whereas on <strong>Linux</strong>, it switched to NFC (ö: 246).</p>

<p><strong>The solution?</strong></p>

<p>– Post-upload, before saving the file as an entity, I applied <code class="language-plaintext highlighter-rouge">.normalize()</code> to the filename, ensuring it was uniformly searchable.</p>

<p>– Additionally, as a cleanup step — to write a migration script to normalize the names of all existing files with non-ASCII characters.</p>

<p>A simple string normalise proved effective in this case. ✅<br />
Read more about <code class="language-plaintext highlighter-rouge">String.prototype.normalize()</code> <a href="https://developer.mozilla.org/en-US/docs/Web/JavaScript/Reference/Global_Objects/String/normalize#canonical_equivalence_normalization">here</a>. There is also a specific normalization option to pass to ensure canonically equivalent normalization — for example: <code class="language-plaintext highlighter-rouge">string.normalize("NFC")</code></p>

<p>Here’s a visual representation of the problem with the solution output:</p>

<p><a href="https://drive.google.com/file/d/1Jkp8ye47iRfDoeTaMQkkskY_BTHegj_D/view">https://drive.google.com/file/d/1Jkp8ye47iRfDoeTaMQkkskY_BTHegj_D/view</a></p>

<video controls="" src="https://drive.google.com/file/d/1Jkp8ye47iRfDoeTaMQkkskY_BTHegj_D/view"></video>

<p>Hope it helps!</p>]]></content><author><name></name></author><category term="Javascript" /><category term="browsers" /><category term="encoding" /><category term="files" /><category term="javascript" /><category term="programming" /><summary type="html"><![CDATA[I implemented search and filtering for entities on our product at epilot. The users were heavily using the feature, however, a unique issue surfaced: difficulties in filtering file names containing diacritical marks like umlauts (Äpfel, über, schön, etc.).]]></summary></entry><entry><title type="html">How using Server-Timing API helped bring &amp;gt; 70% perf improvement</title><link href="https://unravelweb.dev/2024/01/07/how-using-server-timing-api-helped-bring-70-perf-improvement/" rel="alternate" type="text/html" title="How using Server-Timing API helped bring &amp;gt; 70% perf improvement" /><published>2024-01-07T00:00:00+00:00</published><updated>2024-01-07T00:00:00+00:00</updated><id>https://unravelweb.dev/2024/01/07/how-using-server-timing-api-helped-bring-70-perf-improvement</id><content type="html" xml:base="https://unravelweb.dev/2024/01/07/how-using-server-timing-api-helped-bring-70-perf-improvement/"><![CDATA[<p>When working on the web, we all end up coming across situations where the experience for the user seems a bit janky. This happens either when you are dogfooding, or the users actually highlight facing that slowness, or you see that for yourself in your performance metrics or tools.</p>

<p>What one’d do in such a situation is look at the obvious things first: are the images loaded lazily? Is the bundle size too big? Is the main thread blocked? How is the performance panel recording looking? Is the data coming from the backend taking more time than it should?</p>

<p>If it’s one of the first problems, we’d fire up our favorite devtools and try to find out the root cause. If it’s the data being slow, we could see how long that is taking in the network requests duration. And, if it does end up being slow from the backend, the next step would be to dive into some logs and checking what piece of code in the request endpoint takes the time, or embedding some performance information in the response, or using other performance tools etc.</p>

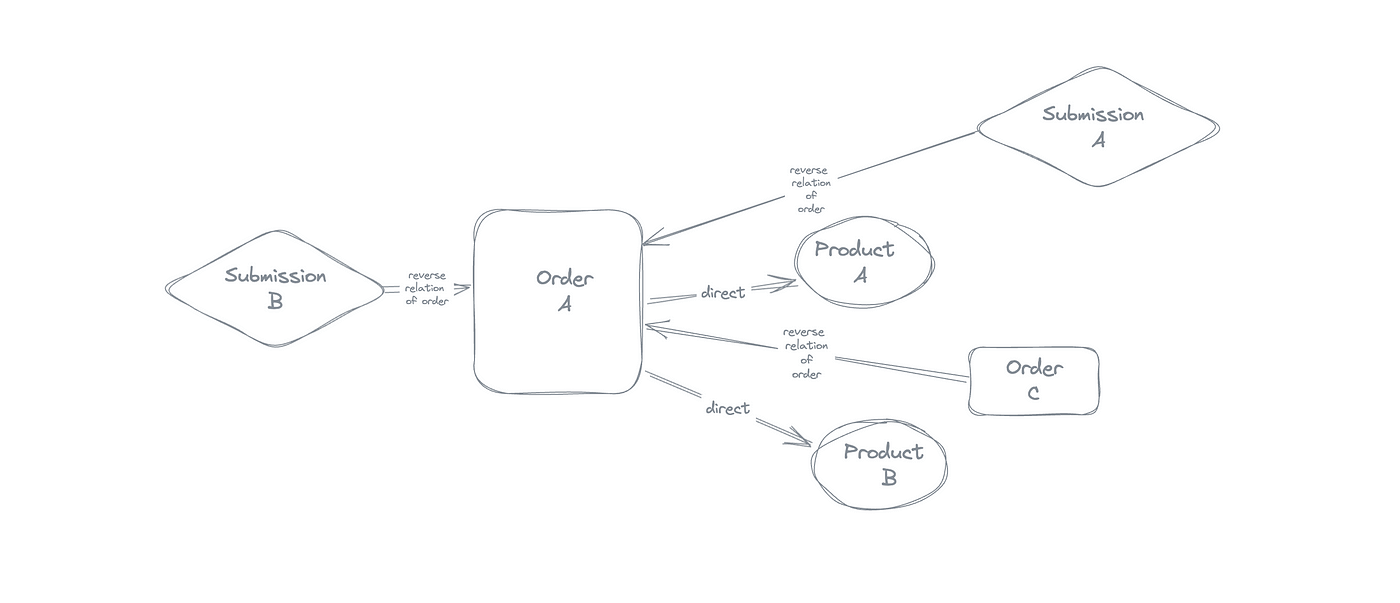
<p>We had a similar situation at <a href="https://epilot.cloud/">epilot</a> where we use <a href="https://www.elastic.co/">Elasticsearch</a> to look for all related products of an order for example, and also all the other entities the order itself might be a relation to.</p>

<p>This meant, looking for direct relations of the order but also the reverse relations of that order.</p>

<p>Now in the Elasticsearch world, this meant:</p>

<ol>
  <li>Getting the list of related products of the order.</li>
  <li>Searching through the documents in elasticsearch for all those related IDs.</li>
  <li>Also, searching all other docs for having this one order as a relation to this (the reverse relation example, I shared above).</li>
  <li>Finally returning all the found relations.</li>
</ol>

<p><img src="/assets/img/e7e2d0-1.png" alt="" /></p>

<p>Showcasing two products as relations of an order</p>

<p><img src="/assets/img/2f8b0d-2.png" alt="" /></p>

<p>Entities and relationships</p>

<p>This worked great for the first few years and got us exactly what we needed quickly. However, as we scaled, the amount of documents indexed in ES increased too, and that meant, the <em>step 3</em> above started getting expensive and slow! The logic was to look for an entity ID in all the indexed documents and find if it is a relation or not. For orders with a lot of products, the endpoint would respond in seconds.</p>

<p>We had to fix the logic/ update the design asap.</p>

<p>The first solution was to update the ES query to make it more specific about what is being looked up, and then check if it improved with that query change and how the results looked for the entities with many relations. This meant looking into a crazy amount of <a href="https://aws.amazon.com/cloudwatch/">Cloudwatch</a> logs and looking at the total time taken and if it was any better.</p>

<p>We made a change to <a href="https://www.elastic.co/guide/en/elasticsearch/reference/current/query-dsl-ids-query.html">search query to be an IDs specific query</a> which would look through only the IDs in the indexed docs, and not through all the fields in those ES documents.</p>

<div class="language-plaintext highlighter-rouge"><div class="highlight"><pre class="highlight"><code>GET /_search
{
  "query": {
    "ids" : {
      "values" : ["1", "4", "100"]
    }
  }
}
</code></pre></div></div>

<p>The expectation was this would completely solve the problem and be super quick. This wasn’t the case unfortunately.</p>

<p>What we were missing was to see which part of the code was really adding to the time taken by the endpoint. We needed to observe the different steps in the process and see all the sections where the time taken could be reduced. We needed to see if it was really ES that was the culprit.</p>

<p>This is where <em>Server-Timing API</em> came into picture. Something that would break down the request into pieces and give us an idea about what’s expensive. The API allowed to pass the timings specific to a request from the backend to the browser. This meant that we could now see in the network requests, how the response times looked like, which part of the function took more time and so on.</p>

<p>To support this, we need to send a <code class="language-plaintext highlighter-rouge">Server-Timing</code> response header from the backend and time the methods that we needed. Something like this:</p>

<div class="language-plaintext highlighter-rouge"><div class="highlight"><pre class="highlight"><code>HTTP/1.1 200 OK

Server-Timing: db;dur=53, app;dur=47.2
</code></pre></div></div>

<p>The Server-Timing header can send three bits of information:</p>

<ol>
  <li><em>metric name</em></li>
  <li><em>duration</em></li>
  <li><em>description of the metric</em></li>
</ol>

<p>In the above example:<br />
<code class="language-plaintext highlighter-rouge">db</code> — metric name<br />
<code class="language-plaintext highlighter-rouge">dur=53</code> — the time in milliseconds the <code class="language-plaintext highlighter-rouge">db</code> metric took (This is for instance, the time to fetch some data from the Database)<br />
<code class="language-plaintext highlighter-rouge">app</code> — another metric name and <code class="language-plaintext highlighter-rouge">dur=47.2</code> being the time taken for the same.</p>

<p>The header can take multiple metrics separated by commas delivering great information and is super lightweight. Although it is recommended to keep the metric names as small as possible.</p>

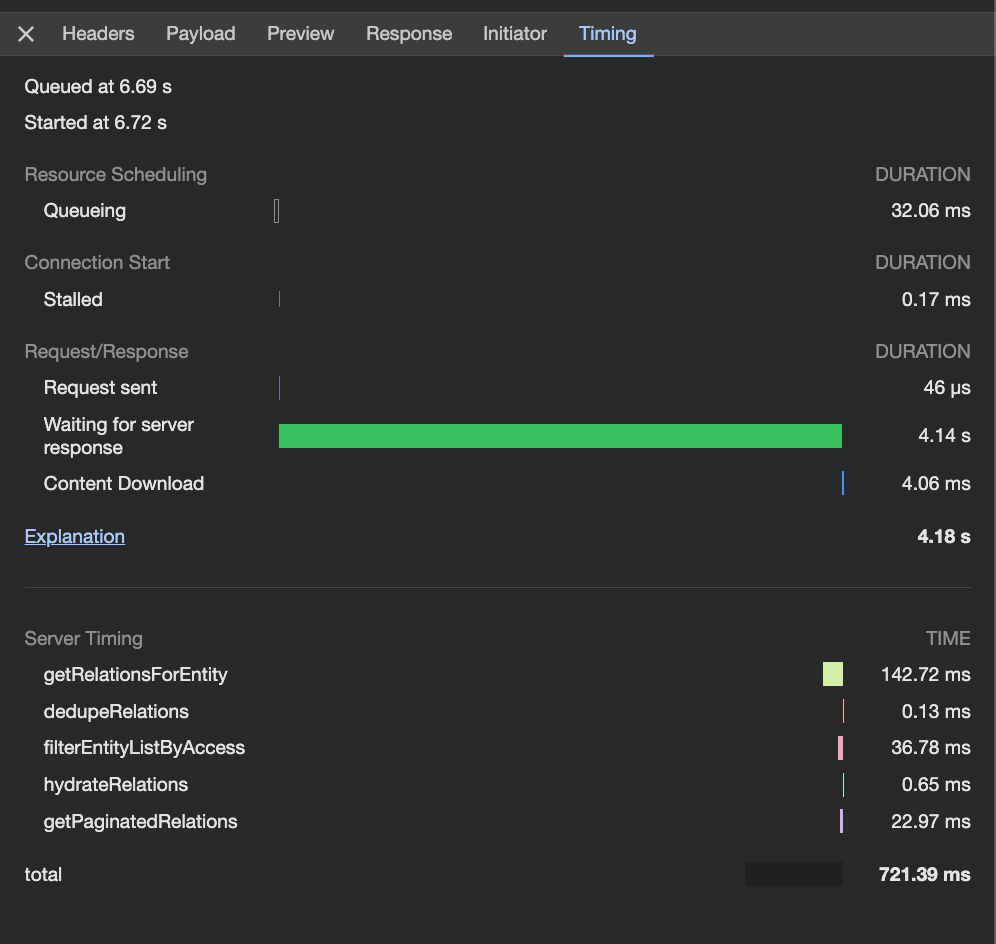
<p>An example of what the returned Server-Timing header looks like:</p>

<div class="language-plaintext highlighter-rouge"><div class="highlight"><pre class="highlight"><code>db; dur=142.715967; desc="getRelationsForEntity",flt; 
dur=36.777609; desc="filterEntityListByAccess",pgn; 
dur=22.96549; desc="getPaginatedRelations",hyd; 
dur=0.64605; desc="hydrateRelations",ddp; 
dur=0.13311699999999999; desc="dedupeRelations",total; dur=721.388338
</code></pre></div></div>

<p>And this information then translates into a more visual and helpful view as a part of the network timings tab of the request OR available via the <a href="https://developer.mozilla.org/en-US/docs/Web/API/PerformanceServerTiming">PerformanceServerTiming</a> interface.</p>

<p>To access the three available properties, they correspond in the <a href="https://developer.mozilla.org/en-US/docs/Web/API/PerformanceServerTiming">PerformanceServerTiming</a> as:</p>

<ul>
  <li><em>“name”</em> -&gt; <a href="https://developer.mozilla.org/en-US/docs/Web/API/PerformanceServerTiming/name">PerformanceServerTiming.name</a></li>
  <li><em>“dur”</em> -&gt; <a href="https://developer.mozilla.org/en-US/docs/Web/API/PerformanceServerTiming/duration">PerformanceServerTiming.duration</a></li>
  <li><em>“desc”</em> -&gt; <a href="https://developer.mozilla.org/en-US/docs/Web/API/PerformanceServerTiming/description">PerformanceServerTiming.description</a></li>
</ul>

<p>Here’s the <a href="https://www.w3.org/TR/server-timing/">working draft</a> with more information.</p>

<p><img src="/assets/img/212a58-3.png" alt="" /></p>

<p>Timings tab to see server response timings</p>

<p><em>These are not available as a series of timings as such and just simple metrics and therefore, do not show in a waterfall pattern.</em></p>

<p>This means we can now tackle both the frontend performance problems and the backend slowness problems all in one place. No jumping to the logs to find a response was slow or heading backing again to the devtools to find the frontend problem.</p>

<p>We could also read the data now available using the navigation (<code class="language-plaintext highlighter-rouge">PerformanceNavigationTiming</code>) and resource timing (<code class="language-plaintext highlighter-rouge">PerformanceResourceTiming</code>) APIs and send it our analytic tools to create metrics/monitors.</p>

<div class="language-plaintext highlighter-rouge"><div class="highlight"><pre class="highlight"><code>const performanceObserver = new PerformanceObserver((list) =&gt; {
  for (const entry of list.getEntries()) {
    log('Server Timing', entry.serverTiming);
  }
});

performanceObserver.observe({type: 'navigation', buffered: true});
</code></pre></div></div>

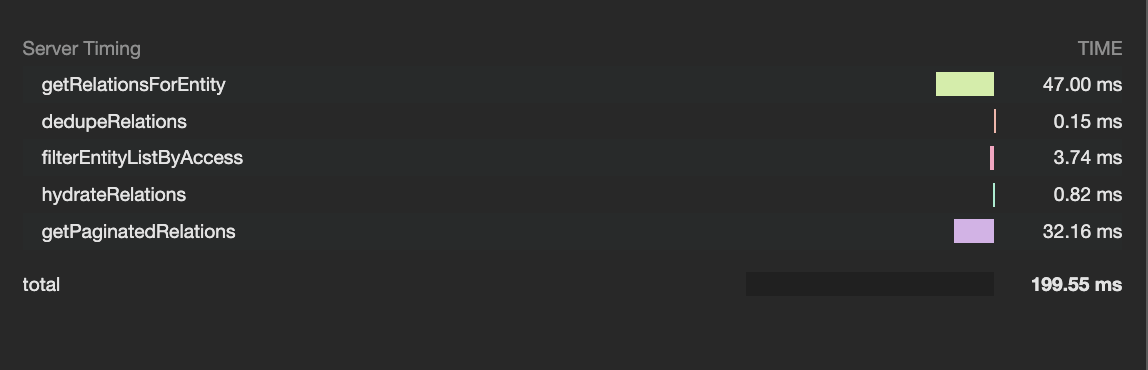
<p>Below is one of the examples from a method taking different amounts of time at different steps in the request. We will set up together the whole setting up and measuring the server response times later in this article.</p>

<p><img src="/assets/img/5912ad-4.png" alt="" /></p>

<p>Server response timings for a request endpoint in Browser devtools</p>

<p>This was especially helpful for the Elasticsearch example that I shared earlier as we needed to know which change was improving what part of the implementation and if it was moving us closer to improved response times. The Server-Timing header does not directly improve the timings but helps find out what could be worked towards.</p>

<p>The uniqueness of the API is that its super flexible and allows the server to communicate important information to the browser, even other than the server timings. It would be amazing to have this supported on Safari as well, which currently lacks the API support.</p>

<h3 id="coming-back-to-how-we-came-down-to-the-api-response-in-400ms-seconds-as-compared-to18s-earlier">Coming back to how we came down to the API response in 400ms seconds as compared to <code class="language-plaintext highlighter-rouge">1.8s earlier</code></h3>

<p><img src="/assets/img/8a45ee-5.png" alt="" /></p>

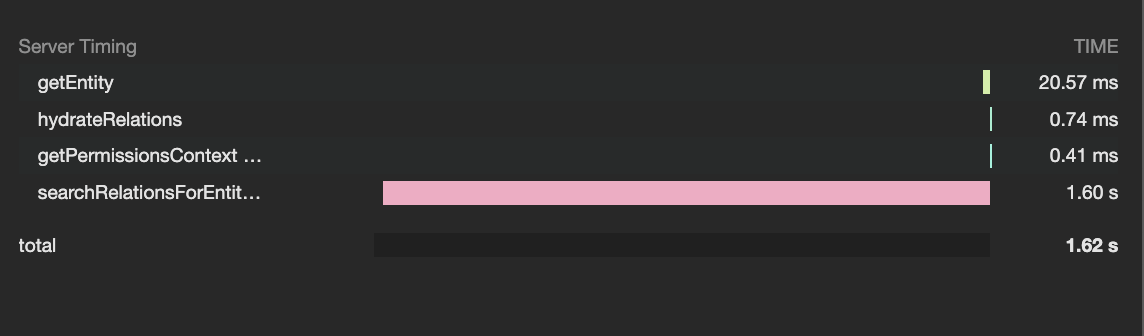
<p>These are the two versions of the API. When we measured the performance with server-timings on the ES implementation after switching to the IDs search query on Elasticsearch, the performance seemed to be taking all the time, especially on this function <code class="language-plaintext highlighter-rouge">searchRelationsForEntity</code> .</p>

<p><img src="/assets/img/6a1f8a-6.png" alt="" /></p>

<p>Server timing indicating huge time taken by method <code class="language-plaintext highlighter-rouge">searchRelationsForEntity</code></p>

<p>Now we knew this was to do with ES but where exactly. We timed specifics inside this method.</p>

<p>On measuring further, it was <code class="language-plaintext highlighter-rouge">entitySearch.searchEntities</code> that was taking up the most time so we needed to find a solution that would not go through all the ES documents at all to get the relation entities.</p>

<p>This is where changing the design made sense, and we moved to a graph table design with Dynamo, which would store all the relationships as mappings, and return all the entity IDs whether as <code class="language-plaintext highlighter-rouge">direct</code> relations or <code class="language-plaintext highlighter-rouge">reverse</code>.</p>

<p>Now we could choose if we wanted to search ES with all the IDs that we have or just batch get the entities from the db, and support pagination (this was an added advantage with ES) etc. separately.</p>

<p>Now, this complete dynamo approach saved us looking through all the indexed documents for the IDs that we need, and also cut some slack on Elasticsearch which would have this unnecessary load, eventually affecting other straightforward searches as well.</p>

<p>This is how the server timings looked with the DynamoDB approach:</p>

<p><img src="/assets/img/72842f-7.png" alt="" /></p>

<p>Server timing indicating reduced times after switching to Dynamo to fetch entity relations</p>

<p>This was an amazing improvement, clearly visible with this significant performance information right in the browser devtools for us. This also ended up helping improve the code in general, to gain some more milliseconds by refactoring, and using performant ways to filter/hydrate/paginate things etc.We love to see the output of what’s in the works, and this was a great example to look at and feel a sense of achievement for.</p>

<h3 id="implementation-of-server-timing-as-a-middleware-for-aws-lambda"><strong><em>Implementation of Server-Timing as a middleware for AWS Lambda</em></strong></h3>

<p>Now if you look up the existence of libraries supporting server-timing header, there are so many but most of them for <em>Express</em> and <em>NodeJS</em>.</p>

<ul>
  <li><a href="https://www.npmjs.com/package/server-timing">server-timing</a></li>
  <li><a href="https://www.npmjs.com/package/server-timings">server-timings</a> etc.</li>
</ul>

<p>We needed to create one for the serverless use case which could be used for AWS Lambda, lets say to use with <a href="https://github.com/middyjs/middy">middy</a> for example.</p>

<h4 id="step-1-create-awithservertimingsmiddleware-to-use-for-aws-lambda">Step 1. Create a <code class="language-plaintext highlighter-rouge">withServerTimings()</code> middleware to use for AWS lambda</h4>

<div class="language-plaintext highlighter-rouge"><div class="highlight"><pre class="highlight"><code>import middy from '@middy/core';
import * as Lambda from 'aws-lambda';

export const withServerTimings = () =&gt; {

  return {
    // add Server-Timing header to response
    after: (handler: middy.Request) =&gt; {
      const response = handler.response as Lambda.APIGatewayProxyStructuredResultV2;
      try {
        const headers: unknown[] = [];
        /**
          This is where the headers with different metrics are be saved
          and retrieved from
        */
        const timings = getServerTimingHeader(headers);
        response.headers = {
          ...response.headers,
          'Server-Timing': timings,
        };
      } catch (e) {
        Log.debug(`Middleware Error: Could not record server timings`, e);
      }
    },
  };
};
</code></pre></div></div>

<p>This creates a usable <code class="language-plaintext highlighter-rouge">withServerTimings()</code> middleware to then be used as:</p>

<h4 id="step-2-apply-the-middleware-to-the-request-handler"><strong>Step 2. Apply the middleware to the request handler</strong></h4>

<div class="language-plaintext highlighter-rouge"><div class="highlight"><pre class="highlight"><code>return middy(handler)
  .use(...)
  .use(withCors())
  .use(withServerTimings())
  .use(...)
</code></pre></div></div>

<p>This already ensures that your backend will now be sending a <code class="language-plaintext highlighter-rouge">Server-Timing</code> header in the request endpoints.</p>

<p>Next step would be to actually time our operations and store them as a common timing variable which can then be sent to the <code class="language-plaintext highlighter-rouge">getServerTimingHeader</code> method for example.</p>

<h4 id="step-3-implement-timing-for-your-methods"><strong>Step 3. Implement timing for your methods</strong></h4>

<div class="language-plaintext highlighter-rouge"><div class="highlight"><pre class="highlight"><code>const times = new Map&lt;string, Record&lt;string, unknown&gt;&gt;();

// starting the timer on a method
const startTimer = (name: string, description?: string) =&gt; {
  times.set(name, {
    name,
    description: description || '',
    startTime: process.hrtime(),
  });
};

// ending the timer and recording the duration of the method
const endTimer = (name: string, description?: string) =&gt; {
  const timeObj = times.get(name);
  if (!timeObj) {
    return console.warn(`No such name ${name}`);
  }

  const duration = process.hrtime(timeObj.startTime as [number, number]);
  const value = duration[0] * 1e3 + duration[1] * 1e-6;

  timeObj.value = value;
  times.delete(name);
  return timeObj;
};

// finally setting the metric value received from endTimer object
const metric =
  typeof description !== 'string' || !description
    ? `${name}; dur=${dur ?? 0}`
    : `${name}; dur=${dur}; desc="${description}"`;
</code></pre></div></div>

<p>This would then be used as:</p>

<h4 id="step-4-usage-of-timers-of-the-methods"><strong>Step 4. Usage of timers of the methods</strong></h4>

<div class="language-plaintext highlighter-rouge"><div class="highlight"><pre class="highlight"><code>startTime('db', 'getRelationsForEntity');
const relations = await getRelationsForEntity({
  ...
});
endTime('db', 'getRelationsForEntity');
  .
  .
  .
startTime('pgn', 'getPaginatedRelations');
const { relations: paginatedRelations, hits } = getPaginatedRelations({
  ...
});

endTime('pgn', 'getPaginatedRelations');
</code></pre></div></div>

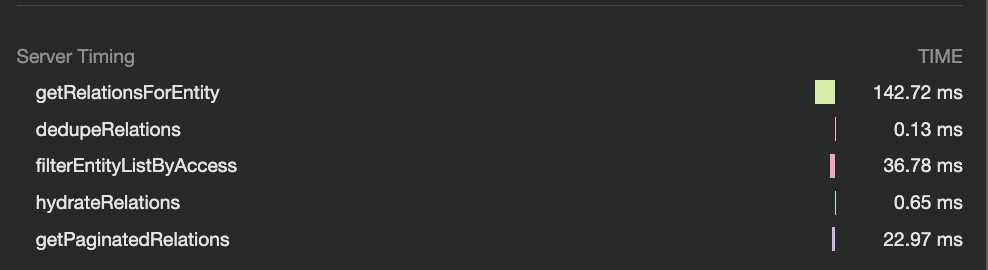
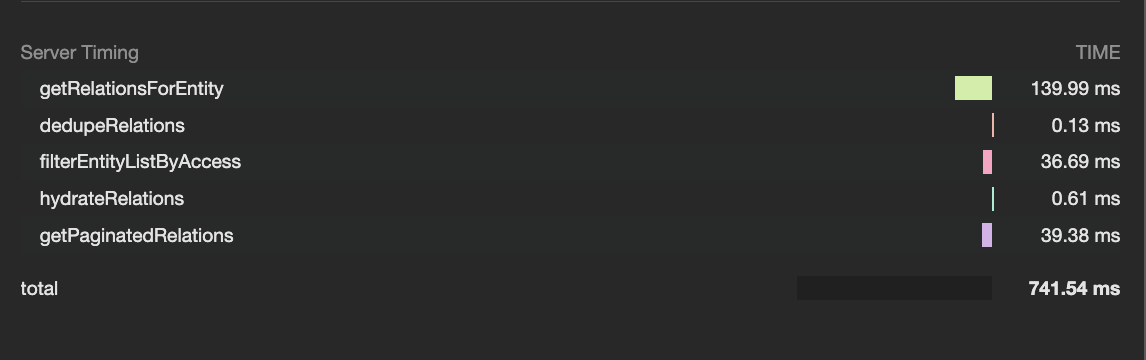
<p>And there we go, we will have the timed methods and the server headers looking like:</p>

<div class="language-plaintext highlighter-rouge"><div class="highlight"><pre class="highlight"><code>db; dur=139.99; desc="getRelationsForEntity",flt; dur=36.68; desc="filterEntityListByAccess",
pgn; dur=39.37; desc="getPaginatedRelations",hyd; dur=0.61;
desc="hydrateRelations",ddp; dur=0.130; desc="dedupeRelations",
total; dur=741.53
</code></pre></div></div>

<p><img src="/assets/img/038a51-8.png" alt="" /></p>

<p><strong>Visual representation of the server-timing headers</strong></p>

<p>All the timing implementation and setting up the middleware can be a hassle, and should be a one-time job. I created a package out of this implementation called <code class="language-plaintext highlighter-rouge">lambda-server-timing</code>:</p>

<ul>
  <li><strong><a href="https://www.npmjs.com/package/lambda-server-timing">lambda-server-timing</a></strong> (npmjs.com)</li>
  <li>
    <p><strong><a href="https://github.com/NishuGoel/lambda-server-timing">GitHub – NishuGoel/lambda-server-timing</a></strong> (github.om)</p>
  </li>
  <li><code class="language-plaintext highlighter-rouge">withServerTimings</code> to use a middleware</li>
  <li><code class="language-plaintext highlighter-rouge">startTime</code> to start measuring a function/set of functions</li>
  <li><code class="language-plaintext highlighter-rouge">endTime</code> to end the timing of the function/set of functions and get the metric set.</li>
</ul>

<div class="language-plaintext highlighter-rouge"><div class="highlight"><pre class="highlight"><code>import {withServerTimings, startTime, endTime } from 'lambda-server-timing';
</code></pre></div></div>

<p>Let’s time our functions down!</p>

<p>References</p>

<ul>
  <li><a href="https://www.w3.org/TR/server-timing/">Working draft</a></li>
  <li><a href="https://developer.mozilla.org/en-US/docs/Web/HTTP/Headers/Server-Timing">MDN Server Timing</a></li>
  <li><a href="https://www.w3.org/TR/navigation-timing/">Navigation Timing</a></li>
  <li><a href="https://www.w3.org/TR/resource-timing/">Resource Timing</a></li>
</ul>]]></content><author><name></name></author><category term="Javascript" /><category term="javascript" /><category term="lambda" /><category term="performance" /><category term="serverless" /><category term="web" /><summary type="html"><![CDATA[When working on the web, we all end up coming across situations where the experience for the user seems a bit janky. This happens either when you are dogfooding, or the users actually highlight facing that slowness, or you see that for yourself in your performance metrics or tools.]]></summary></entry><entry><title type="html">the “fancy” year</title><link href="https://unravelweb.dev/2022/12/30/the-fancy-year/" rel="alternate" type="text/html" title="the “fancy” year" /><published>2022-12-30T00:00:00+00:00</published><updated>2022-12-30T00:00:00+00:00</updated><id>https://unravelweb.dev/2022/12/30/the-fancy-year</id><content type="html" xml:base="https://unravelweb.dev/2022/12/30/the-fancy-year/"><![CDATA[<blockquote>
  <p>I have come to realise a pattern in my past few years.</p>
</blockquote>

<p>It happens to be a series of one type of things that I do, and I do a lot of that for the year. For example, 2018 was “writing blog posts” year, wrote more than 50 blog posts. 2019, “the reading books” years, read 36 or so books that year. 2021, again a lot of writing that year, 2022, “insane traveling” year.</p>

<h1 id="tldr">TL;DR</h1>

<p><img src="https://unravelweb.dev/wp-content/uploads/2022/12/1p0DkR2KAEnRQiCrmN3xkXQ.jpg" alt="" /></p>

<p>Courtesy: Revolut</p>

<p>When I started this year, I was aware of one travel that was going to happen, for sure. It was the one that involved me moving to a different country to work. However, there was so much more in store than what I expected.<br />
It felt like telling Covid that enough of your shit.<br />
The point is, I ended up traveling to all the countries that I would think about traveling to, one day. And I wouldn’t have been writing this proudly, if it was not work-related. All of the travel was tech related. And what can be better than that?</p>

<p>Started the year with speaking at my favourite conference — <a href="https://www.ng-ind.com/">ngIndia</a>, and the energy was crazy since it was happening now after covid. Knowledgeable speakers, getting to know people.</p>

<p><img src="https://unravelweb.dev/wp-content/uploads/2022/12/1QPnJJHLMpKtob78mU2zSrA.jpg" alt="" /></p>

<p><img src="https://unravelweb.dev/wp-content/uploads/2022/12/1GgU93C3xPoO_iHY8Y2QNvA.jpg" alt="" /></p>

<p><img src="https://unravelweb.dev/wp-content/uploads/2022/12/1X6xMa6DgeXbJRzoTe4fU-Q.jpg" alt="" /></p>

<p>I joined <a href="https://epilot.cloud/">epilot</a> beginning of this year which involved lots of learning and working with amazing people and in the best work culture one could have.<br />
One important thing I realised was:</p>

<blockquote>
  <p>“A company is really doing something right, if even its engineers talk about the product (bigger picture) with as wide eyes and great passion as the founders.”</p>
</blockquote>

<p>And I see this at epilot everyday and this inspires me so much to have such a culture at my own company, someday.<br />
Like I mentioned in the beginning, this year was so much traveling and I am going to write small interesting instances from all my trips here, so I can come back later to this and smile.</p>

<p>Started with me traveling to the company summit in Germany which involved a week of fun with colleagues. This was when I got to know that. a beer CAN cost less than water sometimes if you are in Germany 🙂 Also saw, the team that parties crazy also achieves crazy.</p>

<p><img src="https://unravelweb.dev/wp-content/uploads/2022/12/12fT6wrnjmDriTi0dsNC9CA.jpg" alt="" /></p>

<p><img src="https://unravelweb.dev/wp-content/uploads/2022/12/1mtuRRNShhbCnZzoroy142w.jpg" alt="" />
<img src="https://unravelweb.dev/wp-content/uploads/2022/12/1fLZ8jrcHXIegwv1bIs8Ojg.jpg" alt="" /></p>

<p>And before it starts sounding like an epilot appreciation post, I should also mention the amazing time I had at the GDE summit in Leh Ladakh. All the Google developer experts coming together after covid, meeting in person, doing activities, playing games, was exactly what was needed after those two dreadful years.</p>

<p><img src="https://unravelweb.dev/wp-content/uploads/2022/12/114BqG5gDduPOEBS5fZC1lg.jpg" alt="" /></p>

<p><img src="https://unravelweb.dev/wp-content/uploads/2022/12/1Yqz0mH_dLYX3CjO9MP8_wQ.jpg" alt="" /></p>

<p>September brought the wave of travel and never stopped until December. I moved to a new place here in Köln, and the next day I was traveling to Romania already for a web talk at Devfest Craiova about JavaScript Surprises. It was a one day event meeting amazing developers followed by a wonderful day out in the city.</p>

<p><img src="https://unravelweb.dev/wp-content/uploads/2022/12/1Z4pM6Sapdb2QnHqrikSPwA.jpg" alt="" /></p>

<p><img src="https://unravelweb.dev/wp-content/uploads/2022/12/1y0vgNoc16lFkjLo9u2KsfQ.jpg" alt="" /></p>

<p>Visited the <a href="https://en.wikipedia.org/wiki/Nicolae_Romanescu_Park">Nicolae Romanescu Park</a>, the largest natural park in Eastern Europe, apparently. I think the highlight of the Romania trip would be the Papanași that I had and the <a href="https://en.wikipedia.org/wiki/S%C3%A2rb%C4%83">Sârbă</a> dance we did at a get together dinner event.</p>

<p><img src="https://unravelweb.dev/wp-content/uploads/2022/12/11NsG95e_gsseT-9AIaUOlw.jpg" alt="" /></p>

<p><img src="https://unravelweb.dev/wp-content/uploads/2022/12/1T4NlGhNivdrIzPeoxgza5w.jpg" alt="" /></p>

<p>This was followed by a surprise opportunity to visit the Firebase Summit in New York as an Angular GDE. And New York is a dreamy city until you have visited it at least once. This was great fun as well with fellow GDEs exploring all the touristy stuff — Times Square, Wall street, Helicopter View of the city, Brooklyn bridge, Statue of Liberty, Cruise tour, Summit One Vanderbilt etc. The highlight has to be the event venue which surrounded The Little Island.</p>

<p><img src="https://unravelweb.dev/wp-content/uploads/2022/12/1Xk-eX5UKyms3YhDhesGJsg.jpg" alt="" /></p>

<p><img src="https://unravelweb.dev/wp-content/uploads/2022/12/17FNVOuFWH-GJKxEvgMCUJA.jpg" alt="" /></p>

<p><img src="https://unravelweb.dev/wp-content/uploads/2022/12/1GgiwIKoCso4xQEflF_dBig.jpg" alt="" /></p>

<p><img src="https://unravelweb.dev/wp-content/uploads/2022/12/1C1Zeyd77nxkjCzok-4Ysdg.jpg" alt="" /></p>

<p>Next was a talk at JavaScript Poland in Warsaw, which was a trip full of learning. Attending workshop on <a href="https://qwik.builder.io/">Qwik</a>, learning about <a href="https://partytown.builder.io/">Partytown</a>, <a href="https://www.solidjs.com/guides/getting-started">Solid.js</a> and reactivity conversation with Ryan, Streaming concept and Out of Order streaming, etc. The highlight would be meeting <a href="https://twitter.com/ngKalbarczyk">Dariusz</a> after 3 years of meeting him for the first time in <a href="https://www.ng-ind.com/">ngIndia</a> and the beautiful JS Poland stage.</p>

<p><img src="https://unravelweb.dev/wp-content/uploads/2022/12/13ZsR2-9HcH6RtVYq9LKmpg.jpg" alt="" /></p>

<p><img src="https://unravelweb.dev/wp-content/uploads/2022/12/1E_AbSvnf3-DAs4gTHwJCSg.jpg" alt="" /></p>

<p>Had a work vacation planned in Vienna, Austria in November and boy, the city is beautiful. We stayed at a hostel called Jo and Joe which had a creative element to it. We walked around the city and I got to see the first snow of the season there as well. The highlight of the trip was really just enjoying, playing with colleagues, winning the Dart game, but cluelessly 🙂</p>

<p><img src="https://unravelweb.dev/wp-content/uploads/2022/12/1YFFQEppPTMP6V71M3dOtjA.jpg" alt="" /></p>

<p><img src="https://unravelweb.dev/wp-content/uploads/2022/12/1wk8DJQ0q5Pihh431PWcOag.gif" alt="" /></p>

<p>Last but not the least was the trip to London for another Devfest event. This as quite unexpected as I had visa issues until two days before the travel, but ended up working out a day before, and how could I miss it then. Shared about JavaScript Memory Usage at Devfest London, again followed by a day out in the city, again some touristy stuff, but also great conversation with fellow speakers.</p>

<p><img src="https://unravelweb.dev/wp-content/uploads/2022/12/1l_VApAKmQndpEBt4k8XSWw.jpg" alt="" /></p>

<p>I happened to be in London during Christmas and that in itself is the best highlight, but there were so many. It snowed there making it even more beautiful, sitting in those London special red buses. Walking around the city and having important conversation with a friend was what made it all worth.</p>

<p><img src="https://unravelweb.dev/wp-content/uploads/2022/12/1BoCBbs6Cc-D_mwf0Cerg2g.jpg" alt="" /></p>

<p><img src="https://unravelweb.dev/wp-content/uploads/2022/12/1nlcB4t8UTnU8AmFHwyAsgg.jpg" alt="" /></p>

<p>You know how when we realise a pattern, it is no more fun to still let it going. We, at least I like to see if the pattern can be broken and can something good come out of it. I think, I would really not want this year to be a series of one kind of thing.<br />
Would really like it to be a mix of all kinds of things I like to, need to do, with the right amount of balance, consistency etc. Looking forward to writing, reading, creating more value this year. 🙂</p>

<p>Also, moving is quite an adventure. We introduce new music, food, culture, and new habits in general to our lives, sometimes language as well. Example being, 😀</p>

<p><img src="https://unravelweb.dev/wp-content/uploads/2022/12/1cbKLHbvwRXfpPaSUbjunQQ.jpg" alt="" /></p>

<p><img src="https://unravelweb.dev/wp-content/uploads/2022/12/1QjtnrhaU4G6CUJnt2sG8Ww.jpg" alt="" /></p>

<p>Some talks:<br />
– <a href="https://gdg.community.dev/events/details/google-gdg-london-presents-gdg-london-devfest-2022-1/">Devfest London</a><br />
– <a href="https://jspoland.pl/speaker/nishu-goel">JS Poland</a><br />
– <a href="https://youtu.be/_DY4sTCugkU">Devfest Craiova</a> (<em>recording</em>)<br />
– <a href="https://gdg.community.dev/events/details/google-gdg-bangalore-presents-devfest-bangalore-2022/">Devfest Bangalore</a><br />
– <a href="https://youtu.be/ydCCndGRo-g">ngIndia</a> (<em>recording</em>)<br />
– <a href="https://webdirections.org/globalscope/">Web Directions — Global Scope</a></p>

<p>Some slides:<br />
– <a href="https://docs.google.com/presentation/d/1o9qS5VoguhcbuW1MvzC1nEluJ5VZJQ5ULeeDTUb_Rs8/edit?usp=sharing">microFrontends</a><br />
– <a href="https://docs.google.com/presentation/d/1gHd_vTsA_PnSC76zR3W37kRYMmEHNE4U/edit?usp=sharing&amp;ouid=110120705238669915810&amp;rtpof=true&amp;sd=true">JavaScript Surprises</a><br />
– <a href="https://docs.google.com/presentation/d/1CVNdNywodV5VAm0N1MYKWI3WMR709Rvy/edit?usp=sharing&amp;ouid=110120705238669915810&amp;rtpof=true&amp;sd=true">Understanding JS memory Usage</a></p>

<p>Some writings:<br />
– <a href="https://calendar.perfplanet.com/2022/breaking-up-long-tasks/">Breaking up long tasks — Perf Calender</a><br />
– <a href="https://unravelweb.dev/2022/03/20/dabbling-at-epilot-with/">Dabbling at epilot</a><br />
– <a href="https://medium.com/@nishugoel/unraveling-the-web-w-nishu-goel-70227097d8f">Unraveling the Web</a><br />
– <a href="https://medium.com/epilot/svelte-i18next-e0c6591a8fcc">Svelte-i18next</a></p>

<p>Some books read:<br />
– The midnight library<br />
– The T-shirts I love<br />
– Thinking fast and Slow<br />
– AI 2041<br />
– The Bitcoin Standard<br />
etc.</p>

<p>Prost! 🍻</p>]]></content><author><name></name></author><category term="Javascript" /><category term="code" /><category term="javascript" /><category term="tech" /><category term="web" /><summary type="html"><![CDATA[I have come to realise a pattern in my past few years.]]></summary></entry><entry><title type="html">Breaking up long tasks</title><link href="https://unravelweb.dev/2022/12/25/breaking-up-long-tasks/" rel="alternate" type="text/html" title="Breaking up long tasks" /><published>2022-12-25T00:00:00+00:00</published><updated>2022-12-25T00:00:00+00:00</updated><id>https://unravelweb.dev/2022/12/25/breaking-up-long-tasks</id><content type="html" xml:base="https://unravelweb.dev/2022/12/25/breaking-up-long-tasks/"><![CDATA[<p>Imagine the scenario where you click on an element and expect a response but the element doesn’t seem like it was clicked and doesn’t respond, so you click again. Those two clicks however, when the response completes, lead to undoing the action you wanted. Ever happened with you? Sounds frustrating, doesn’t it?</p>

<p>This is the kind of experience, we as web engineers, cannot afford to give to the users. And there can be multiple reasons that could lead to this. If you regularly check the performance of your apps, you would have come across suggestions to code-split your application and reduce shipped JavaScript. In this post, we look at the causes of slow responsiveness of an application, how we could measure the slowness, and the approaches to improve it.</p>

<p><strong>TL;DR</strong><br />
Certain tasks on a user interaction can be blocking, giving the user a broken experience, and resulting in a low INP metric score.</p>

<p>Some ways to optimise it could be:</p>

<ul>
  <li>keep tasks small and dedicated to what they should do.</li>
  <li>use Chrome’s scheduler API to schedule tasks for browser</li>
  <li>yield important tasks to the main thread</li>
</ul>

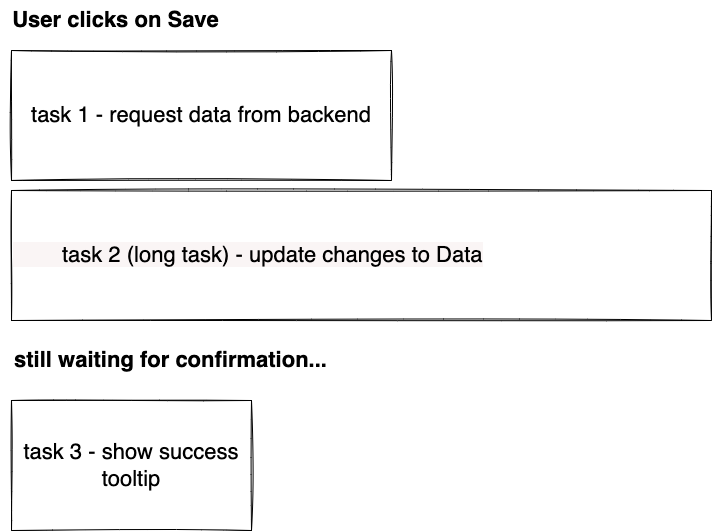
<p>Let us first understand why a user interaction could be slow. When a user interacts with an element on the browser, the user agent takes that as one <em>task</em> and queues it in the list of tasks for the browser. This one task could take more time or less depending on the type of operation needed to be performed. Some tasks take longer resulting in the main thread being busy performing that and leading to the the other tasks being blocked in the meantime.</p>

<h2 id="long-tasks">Long tasks</h2>

<p>A task is considered a long one if it goes beyond <code class="language-plaintext highlighter-rouge">50ms</code> to execute and <code class="language-plaintext highlighter-rouge">50ms</code> to respond, basically, more than <code class="language-plaintext highlighter-rouge">100ms</code>. A website which doesn’t have long tasks, is expected to respond within <code class="language-plaintext highlighter-rouge">100ms</code> with both the execution and response time on a user input, according to <a href="https://developers.google.com/web/fundamentals/performance/rail"><strong>RAIL</strong></a>.</p>

<p><img src="https://unravelweb.dev/wp-content/uploads/2022/12/1xL18Za1d-NSLZ2gH7P7BNw.png" alt="" /></p>

<p>long task blocking user response</p>

<p>As per <a href="https://almanac.httparchive.org/en/2022/javascript#fig-34">data from Web Almanac</a>, it’s interesting to note that a median mobile page tends to have 19 long tasks.</p>

<p>Imagine the scenario where you click on an element and expect a response but the element doesn’t seem like it was clicked and doesn’t respond, so you click again. Those two clicks however, when the response completes, lead to undoing the action you wanted. Ever happened with you? Sounds frustrating, doesn’t it?</p>

<p>This is the kind of experience, we as web engineers, cannot afford to give to the users. And there can be multiple reasons that could lead to this. If you regularly check the performance of your apps, you would have come across suggestions to code-split your application and reduce shipped JavaScript. In this post, we look at the causes of slow responsiveness of an application, how we could measure the slowness, and the approaches to improve it.</p>

<p><strong>TL;DR</strong><br />
Certain tasks on a user interaction can be blocking, giving the user a broken experience, and resulting in a low INP metric score.</p>

<p>Some ways to optimise it could be:</p>

<ul>
  <li>keep tasks small and dedicated to what they should do.</li>
  <li>use Chrome’s scheduler API to schedule tasks for browser</li>
  <li>yield important tasks to the main thread</li>
</ul>

<p>Let us first understand why a user interaction could be slow. When a user interacts with an element on the browser, the user agent takes that as one <em>task</em> and queues it in the list of tasks for the browser. This one task could take more time or less depending on the type of operation needed to be performed. Some tasks take longer resulting in the main thread being busy performing that and leading to the the other tasks being blocked in the meantime.</p>

<h2 id="long-tasks-1">Long tasks</h2>

<p>A task is considered a long one if it goes beyond <code class="language-plaintext highlighter-rouge">50ms</code> to execute and <code class="language-plaintext highlighter-rouge">50ms</code> to respond, basically, more than <code class="language-plaintext highlighter-rouge">100ms</code>. A website which doesn’t have long tasks, is expected to respond within <code class="language-plaintext highlighter-rouge">100ms</code> with both the execution and response time on a user input, according to <a href="https://developers.google.com/web/fundamentals/performance/rail"><strong>RAIL</strong></a>.</p>

<p><img src="https://unravelweb.dev/wp-content/uploads/2022/12/1xL18Za1d-NSLZ2gH7P7BNw.png" alt="" /></p>

<p>long task blocking user response</p>

<p>As per <a href="https://almanac.httparchive.org/en/2022/javascript#fig-34">data from Web Almanac</a>, it’s interesting to note that a median mobile page tends to have 19 long tasks.</p>

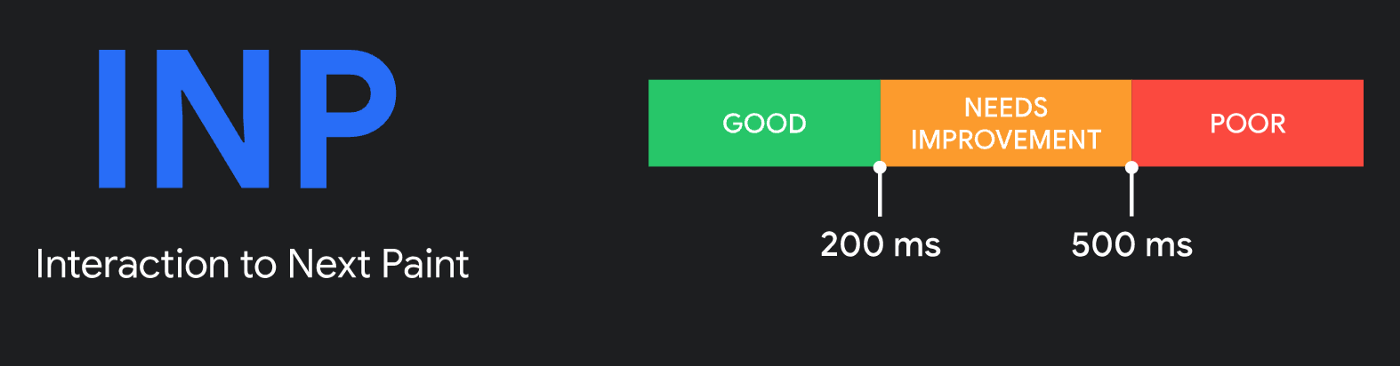
<p>This is where <a href="http://web.dev/inp"><strong>INP</strong></a> comes into picture. INP is a responsiveness metric, stands for Interaction to next paint, which measures the time from when the user interacted with the page until when the next frame was actually visible on the page. A good INP measure is when the time between interaction and the feedback as a result of that interaction is the least.<br />
An interaction could mean events like <code class="language-plaintext highlighter-rouge">tap</code>, <code class="language-plaintext highlighter-rouge">click</code>, <code class="language-plaintext highlighter-rouge">keyUp</code>, <code class="language-plaintext highlighter-rouge">pointerdown</code> etc.</p>

<p>An interesting read <a href="https://web.dev/inp/#:~:text=A%20note%20on%20how%20INP%20is%20calculated"><strong>here</strong></a> on how’s INP actually measured <img src="https://unravelweb.dev/wp-content/uploads/2022/12/1f447.png" alt="" />.</p>

<blockquote>
  <p>INP is calculated by observing all the interactions made with a page. The chosen value is then a <a href="https://en.wikipedia.org/wiki/Percentile">percentile</a> of those interactions. A formula is then used to choose a high percentile value of those interactions.</p>
</blockquote>

<p>The way we put web vital measures in a Good, Needs Improvement, Bad buckets, here is what a good and poor looks like for the INP metric.</p>

<p><img src="https://unravelweb.dev/wp-content/uploads/2022/12/1TDkl2dGgw4NcyL9xO9PYVw.png" alt="" /></p>

<p>To calculate the overall page responsiveness, an INP measure is calculated when the user navigates away from a page, and this comprises of all interactions like mouse events, keyboard events, touch/tap on a touchscreen device.</p>

<h2 id="fid--inp">FID / INP?</h2>

<p>I remember analysing my websites, and always being satisfied with at least one metric of the three core web vitals 😀 — the First Input Delay. Would up my ego a bit that I am doing something good for sure. But if we look at the bigger picture, it is noticed that most websites have a good FID value, even when the responsiveness experience isn’t that great.<br />
And to address this, INP with a better measurement approach has been introduced. <em>INP doesn’t just measure the first interaction but all interactions on a page, unlike FID.</em> <em>Also, as the name says, INP measures the time until the next paint happens, unlike FID, that measures the time only until the processing happens.</em></p>

<p>If we look at the INP scores on mobile devices, <code class="language-plaintext highlighter-rouge">55%</code> of websites have a good INP score, and <code class="language-plaintext highlighter-rouge">36%</code> need improvement. However, in case of FID, <code class="language-plaintext highlighter-rouge">92%</code> of websites having “good” FID. So, a better responsiveness measure with INP already brought down the “<em>good</em>” score.</p>

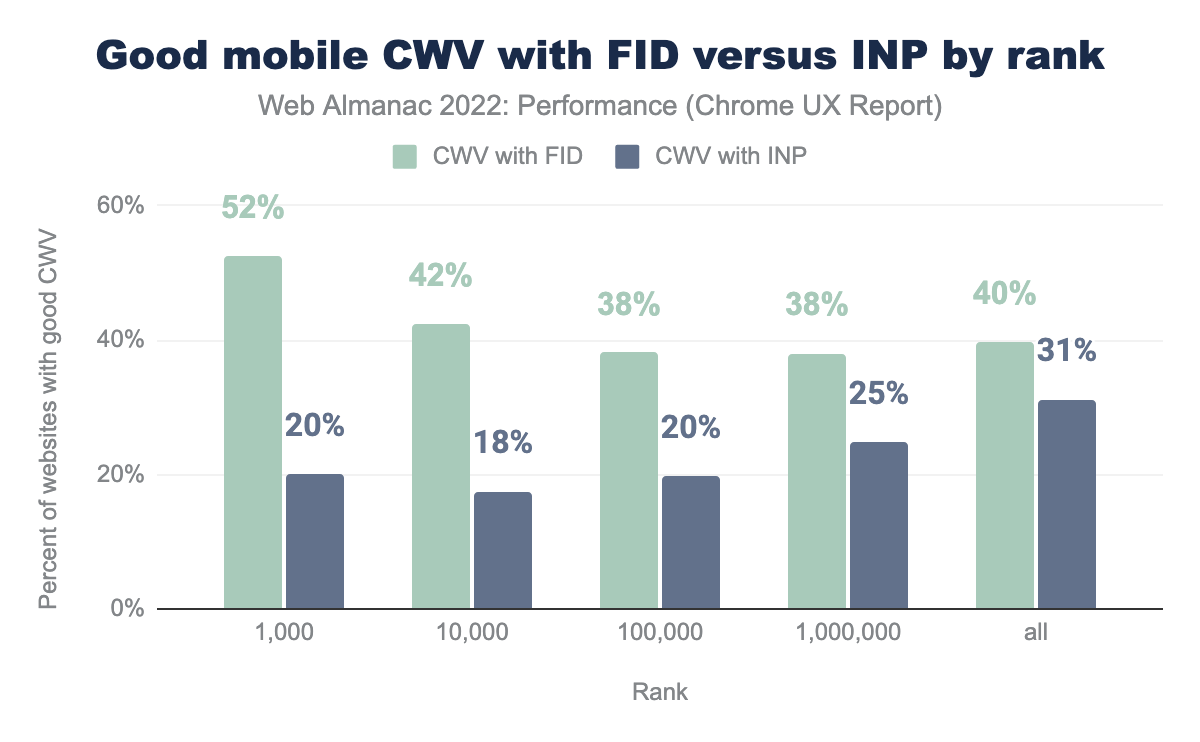
<p>It is also interesting to see that INP score tends to be inversely proportional to the popularity of a website, as <a href="https://almanac.httparchive.org/en/2022/performance#inp-by-rank">per data from the Performance chapter in web almanac</a>.</p>

<p>With a better approach to measure the responsiveness of a website with INP, it would make sense for developers to really start considering this metric as an important performance check, also with Google considering to replace FID with INP as one of the core web vitals.</p>

<p><img src="/assets/img/51e4d2-0LHAYRA8tQLsCo8hT.png" alt="" /></p>

<p>When looking at the mobile experiences by site rank, <code class="language-plaintext highlighter-rouge">52%</code> of top 1K websites fall in the <em>good</em> category with <code class="language-plaintext highlighter-rouge">FID</code> metric, however only <code class="language-plaintext highlighter-rouge">20%</code> pass with good status with <code class="language-plaintext highlighter-rouge">INP</code> as a metric, and this is a huge difference hinting towards the need to really improve the overall responsiveness situation, <em>long tasks</em> being one of the things to solve.</p>

<h2 id="can-i-track-my-websites-inp-value">Can I track my website’s INP value?</h2>

<p>One cool way to track our website’s interaction to next paint measure with real data from users is using the <code class="language-plaintext highlighter-rouge">web-vitals</code> library.</p>

<p>The library offers the <code class="language-plaintext highlighter-rouge">onINP</code> method that returns the type of event along with the INP value.</p>

<p>We could record this data and then receive it via some API or analytics provider to be able to understand the reasons behind the INP measure based on the real usage from field.</p>

<p>Something like this: <img src="https://unravelweb.dev/wp-content/uploads/2022/12/1f447.png" alt="" /></p>

<div class="language-plaintext highlighter-rouge"><div class="highlight"><pre class="highlight"><code>import {onINP} from 'web-vitals';
onINP(({name, value, attribution}) =&gt; {
  console.log(name)
  console.log(value)
  console.log(attribution.eventType)
});
</code></pre></div></div>

<p>This gives us the measure of our INP and helps us understand further how we this interaction delay be improved.</p>

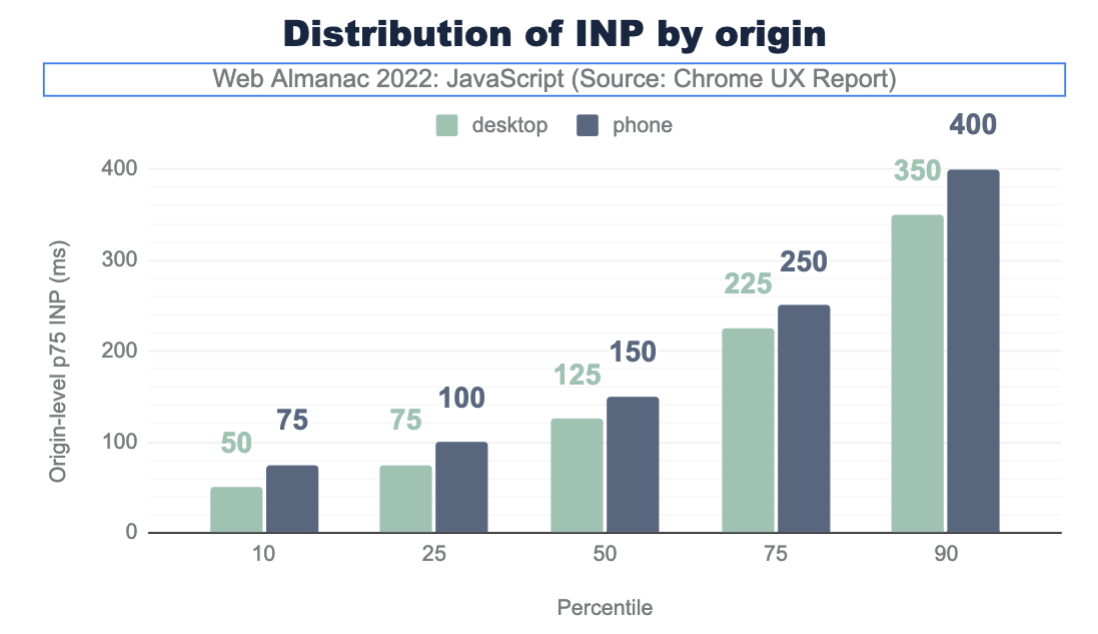
<p>This is how the general INP score looked like on websites as per the <a href="https://almanac.httparchive.org/en/2022/javascript#fig-31">data from Web almanac</a>.</p>

<p><img src="https://unravelweb.dev/wp-content/uploads/2022/12/1bW6-vitoEI2WrJwN2nPWkA.png" alt="" /></p>

<h2 id="how-do-you-find-a-long-task-in-your-application">How do you find a long task in your application?</h2>

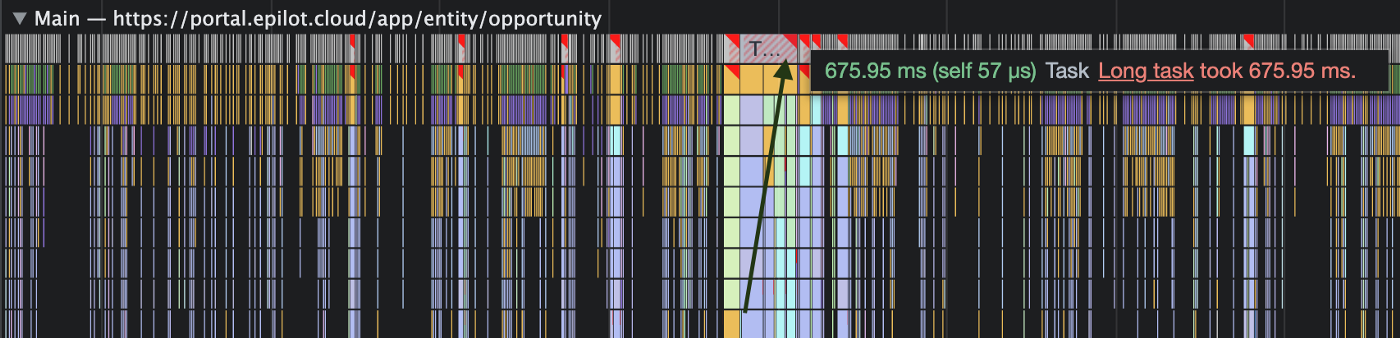
<p>By now, we would know how the INP value is doing, and the next step right away would be to profile our app and see the improvement areas. To do this, we go straight to the performance profiler and identify the long tasks (ones exceeding the threshold of <code class="language-plaintext highlighter-rouge">50ms</code>).</p>

<p><img src="/assets/img/d2b898-1wkzegeMZDBrgwVWvrr0OaA.png" alt="" /></p>

<p>As we can see, there are many long tasks leading to slower input response to the user, one such having a delay of <code class="language-plaintext highlighter-rouge">676ms</code>.</p>

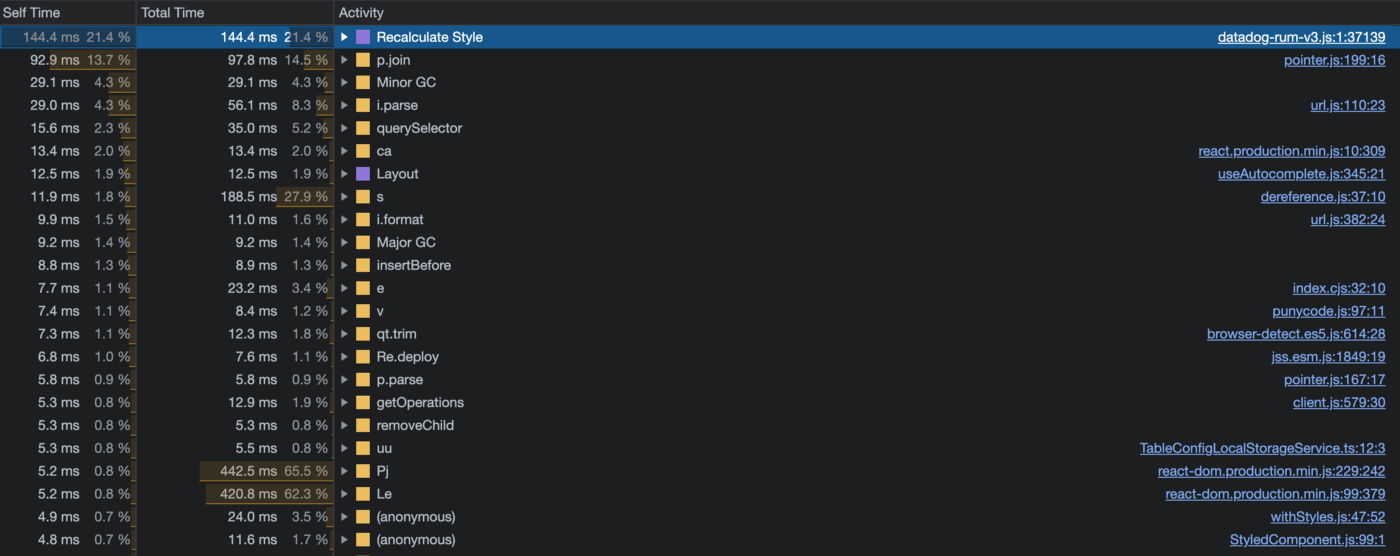
<p>And as we dive deeper, it gives us some idea about the operations causing this to go up to <code class="language-plaintext highlighter-rouge">600ms</code> here:</p>

<p><img src="/assets/img/a7967c-1SwdqGhtl9nvkCE8MLaHk6A.png" alt="" /></p>

<p>Let us try to optimise one such long task now. There can be different approaches to improve long tasks, with one being breaking up your long tasks into smaller dedicated tasks.</p>

<p>For example, the long task from above which took <code class="language-plaintext highlighter-rouge">600ms</code>, was a blocking task for UI related updates, and thus would result in a broken experience for the users since they’d see a delayed response. What if the task still does exactly what it does but it is broken into multiple tasks with small operations, meaning:</p>

<ul>
  <li>Task 1 — Only for querySelector step</li>
  <li>Task 2 — parse</li>
  <li>Task 3 — getOperations</li>
  <li>Task 4 — removeChild<br />
and so on.</li>
</ul>

<p>This would then allow us to inform the browser to NOT delay the <code class="language-plaintext highlighter-rouge">removeChild</code> step because of the time-taking <code class="language-plaintext highlighter-rouge">parse</code> step which takes around <code class="language-plaintext highlighter-rouge">5.8ms</code> only for some parsing. And thus, allowing the browser to give a faster visual feedback to the user without having to wait for the multiple expensive steps before that.</p>

<p>Informing the browser to perform a task which is more urgent than others can be called “yielding to the main thread”. One way to do that is using a Promise with a call to a <code class="language-plaintext highlighter-rouge">setTimeout</code> function:</p>

<div class="language-plaintext highlighter-rouge"><div class="highlight"><pre class="highlight"><code>function yieldToMain () {
  return new Promise(resolve =&gt; {
    setTimeout(resolve, 0);
  });
}
</code></pre></div></div>

<p>This <em>setTimeout</em> call will then ensure to run the dedicated step as a separate task prior to the other queued-up tasks. It depends then, how one would want to prioritise their tasks, and when yield exactly.<br />
In our long task example, it would make sense to yield to the main thread after we expect some user visual as a response. For instance, showing a <code class="language-plaintext highlighter-rouge">loading spinner</code> before the <code class="language-plaintext highlighter-rouge">parse</code> step, which would mean that now we already have some response for the user in <code class="language-plaintext highlighter-rouge">271ms</code> instead of the <code class="language-plaintext highlighter-rouge">600ms</code>.<br />
This is already something better as compared to before.</p>

<p>One more use case could be to only wanting to yield to the main thread and perform a crucial task, when we see that there is an action that the user is waiting for a response from. In this case, it would make sense to yield to the main thread only after knowing that some input is pending.<br />
And that’s where the API <code class="language-plaintext highlighter-rouge">isInputPending()</code> comes to the rescue.</p>

<h2 id="isinputpending">isInputPending</h2>

<p>Facebook contributed the <code class="language-plaintext highlighter-rouge">isInputPending</code> API to chromium based browsers which tells the browser if there is a user input that is waiting for a response. This is useful to be able to respond quicker to such tasks that need a visual feedback.</p>

<p>Read more here 👇🏻</p>

<blockquote>
  <p><a href="https://calendar.perfplanet.com/2022/breaking-up-long-tasks/">Breaking up long tasks</a></p>
</blockquote>

<iframe class="wp-embedded-content" data-secret="of8UdvCvUj" frameborder="0" height="338" marginheight="0" marginwidth="0" sandbox="allow-scripts" scrolling="no" security="restricted" src="https://calendar.perfplanet.com/2022/breaking-up-long-tasks/embed/#?secret=of8UdvCvUj" style="position: absolute; clip: rect(1px, 1px, 1px, 1px);" title="“Breaking up long tasks” — Web Performance Calendar" width="600"></iframe>

<p>Web performance calendar 2022</p>]]></content><author><name></name></author><category term="Javascript" /><category term="chrome" /><category term="javascript" /><category term="performance" /><category term="web" /><summary type="html"><![CDATA[Imagine the scenario where you click on an element and expect a response but the element doesn’t seem like it was clicked and doesn’t respond, so you click again. Those two clicks however, when the response completes, lead to undoing the action you wanted. Ever happened with you? Sounds frustrating, doesn’t it?]]></summary></entry><entry><title type="html">Failed to execute ‘removeChild’ on ‘Node’.</title><link href="https://unravelweb.dev/2022/10/22/failed-to-execute-removechild-on-node/" rel="alternate" type="text/html" title="Failed to execute ‘removeChild’ on ‘Node’." /><published>2022-10-22T00:00:00+00:00</published><updated>2022-10-22T00:00:00+00:00</updated><id>https://unravelweb.dev/2022/10/22/failed-to-execute-removechild-on-node</id><content type="html" xml:base="https://unravelweb.dev/2022/10/22/failed-to-execute-removechild-on-node/"><![CDATA[<p>This error is frequently noticed on some projects. Though it seems to be something to do with DOM modification, there seems to be nothing obvious from code where this could be caused.</p>

<p>So, turns out there can be multiple reasons for this to occur:</p>

<ol>
  <li>Applying browser translation on non-wrapped elements.</li>
  <li>Conditionally rendering elements inside React Fragments.</li>
</ol>

<h3 id="applying-browser-translation-on-non-wrapped-elements">Applying browser translation on non-wrapped elements</h3>

<table>
  <tbody>
    <tr>
      <td>Example: Listing labels *(string</td>
      <td>JSX.element)* inside a third-party component.</td>
    </tr>
  </tbody>
</table>

<div class="language-plaintext highlighter-rouge"><div class="highlight"><pre class="highlight"><code>&lt;DropDownMenu
  id="create-menu"
  menuItems={items.map(item =&gt; ({
    name: item.key,
    label: i18n.t(item.slug), // This is where a non-wrapped element is getting translated causing the error
  })}
&gt;

{...}

&lt;/DropDownMenu&gt;
</code></pre></div></div>

<p><strong>Solution:</strong><br />
Passing label as a JSX element instead of a string.</p>

<div class="language-plaintext highlighter-rouge"><div class="highlight"><pre class="highlight"><code>&lt;DropDownMenu
  id="create-menu"
  menuItems={items.map(item =&gt; ({
    name: item.key,
    label: &lt;span&gt;{i18n.t(item.slug)}&lt;/span&gt;, // This is where a non-wrapped element is getting translated causing the error
  })}
&gt;

{...}

&lt;/DropDownMenu&gt;
</code></pre></div></div>

<h3 id="conditionally-rendering-elements-inside-react-fragments"><strong>Conditionally rendering elements inside React Fragments</strong></h3>

<p>We use fragments in React to avoid adding extra nodes. These fragments when used conditionally, for example for a use case like:</p>

<div class="language-plaintext highlighter-rouge"><div class="highlight"><pre class="highlight"><code>&lt;Fragment&gt;
   {!isThisSituation ?  
        &lt;span&gt;Display this&lt;/span&gt;
          :    
        &lt;Icon
            color="secondary"
            fontSize={12}
            name="this-icon"
        /&gt;
    }
&lt;/Fragment&gt;
</code></pre></div></div>

<p>result in React trying to remove the conditionally rendered node from the parent that is a <code class="language-plaintext highlighter-rouge">fragment</code>. However, we know Fragment doesn’t really act as an extra node.</p>

<p><strong>Solution</strong>:</p>

<p>When conditionally rendering nodes, wrap the children inside a legit node.</p>

<div class="language-plaintext highlighter-rouge"><div class="highlight"><pre class="highlight"><code>&lt;div&gt;
   {!isThisSituation ?  
        &lt;span&gt;Display this&lt;/span&gt;
          :    
        &lt;Icon
            color="secondary"
            fontSize={12}
            name="this-icon"
        /&gt;
    }
&lt;/div&gt;
</code></pre></div></div>

<p>Also throws the error for a scenario like this:</p>

<div class="language-plaintext highlighter-rouge"><div class="highlight"><pre class="highlight"><code>// throws the error if:

&lt;div&gt;
  {condition &amp;&amp; 'text'} // solution: needs to be wrapped in an element
  &lt;span&gt;Some other text&lt;/span&gt;
&lt;/div&gt;

OR

&lt;div&gt;
  {condition &amp;&amp; &lt;span&gt;Text&lt;/span&gt;}
  Welcome // solution: needs to be wrapped in an element
&lt;/div&gt;
</code></pre></div></div>]]></content><author><name></name></author><category term="Javascript" /><category term="javascript" /><category term="react" /><summary type="html"><![CDATA[This error is frequently noticed on some projects. Though it seems to be something to do with DOM modification, there seems to be nothing obvious from code where this could be caused.]]></summary></entry><entry><title type="html">dabbling at epilot with…</title><link href="https://unravelweb.dev/2022/03/20/dabbling-at-epilot-with/" rel="alternate" type="text/html" title="dabbling at epilot with…" /><published>2022-03-20T00:00:00+00:00</published><updated>2022-03-20T00:00:00+00:00</updated><id>https://unravelweb.dev/2022/03/20/dabbling-at-epilot-with</id><content type="html" xml:base="https://unravelweb.dev/2022/03/20/dabbling-at-epilot-with/"><![CDATA[<p>Year 2022 marked an amazing start for me with a new stint with <a href="https://epilot.cloud/"><strong>epilot GmbH</strong></a> based out of Cologne, Germany. I joined the team to be working on their micro-frontend architecture, with my primary focus going to be on the performance aspects of the applications. <br />
Like the first recent addition we did after I started was to add <code class="language-plaintext highlighter-rouge">brotli</code> <a href="https://github.com/google/brotli">compression</a> to each of our micro-frontend (MFEs) bundles.</p>

<p><img src="https://unravelweb.dev/wp-content/uploads/2022/10/1CvujCz8dT83A8mMzbBNhEA.png" alt="" /></p>

<p>Let’s look at the tech stack involved.</p>

<h4 id="micro-services">Micro services</h4>

<p>The main <code class="language-plaintext highlighter-rouge">epilot</code> app is built using <code class="language-plaintext highlighter-rouge">microfrontends</code> with each entity as its own application. There is a <code class="language-plaintext highlighter-rouge">login</code> application that takes care of the user login state (built using <em>React + TypeScript</em>), a <code class="language-plaintext highlighter-rouge">topbar</code> application that has features like Global search, notifications (<em>React + TypeScript</em>), a <code class="language-plaintext highlighter-rouge">sidebar</code> application that navigates the user to different entities based on user permissions (<em>Svelte + TypeScript + Tailwind</em>), and so on.</p>

<p>The component library of the product is based on material UI, built with React.</p>

<p><a href="https://www.npmjs.com/package/@epilot/base-elements"><strong>@epilot/base-elements</strong></a></p>

<p>Due to the open source experience of many engineers in the team, most of the non-confidential stuff is kept public on GitHub and npm.<br />
One of the very interesting things I got to do to ramp up was to build a part of the product as a Svelte MFE. With most of the existing MFEs built using react, this was quite interesting and challenging to do.</p>

<p>We use <a href="http://single-spa.js.org"><strong>single-spa</strong></a> framework to build our <code class="language-plaintext highlighter-rouge">microfrontends</code> and use different frameworks per the ease and knowledge of an engineer. To make the development journey easier for a new developer starting up with microfrontends, we have a <code class="language-plaintext highlighter-rouge">mfe-app-generator</code> package that creates a boilerplate application with the required config.</p>

<p><a href="https://www.npmjs.com/package/@epilot360/mfe-app-generator"><strong>@epilot360/mfe-app-generator</strong></a></p>

<p>Due to performance reasons, one of the goals was to switch to rollup for bundling all our applications, however, we use <code class="language-plaintext highlighter-rouge">webpack</code> due to <a href="https://github.com/aws/aws-sdk-js/issues/1769">rollup’s known issues with</a> <code class="language-plaintext highlighter-rouge">aws-sdk</code>.</p>

<p>We use serverless microservices architecture exposed via APIs. Most of the backend services are written in TypeScript using AWS lambda functions, APIs, Cloudfront distribution etc. More on that <a href="https://docs.epilot.io/docs/architecture/overview">here</a>.</p>

<p>With Svelte added to our microfrontend stack, we plan to further diversify the frameworks to be used, ensuring to not lose focus on the performance aspect of the application. <a href="https://single-spa.js.org/docs/ecosystem">Here’s a list of support frameworks by single-spa.</a></p>

<p>I also plan to share our journey from a high <a href="https://web.dev/lcp/">LCP (largest contentful paint)</a> to a much reduced one, but I’d keep it for another blog post.</p>

<p>When working with custom implementation and bundling, one of the challenging tasks is to configure your bundler and ensure it is consistent throughout all the applications (MFEs in this case). We have defined a <code class="language-plaintext highlighter-rouge">@epilot360/webpack-config-epilot360</code> to base one’s webpack config on top of the existing basic config defined.</p>

<p><a href="https://www.npmjs.com/package/@epilot360/webpack-config-epilot360"><strong>@epilot360/webpack-config-epilot360</strong></a></p>

<p>I will share more on the webpack configuration for microfrontends and cache invalidation strategies in another post but <code class="language-plaintext highlighter-rouge">cache invalidation</code> is definitely my major ongoing focus area.</p>

<h4 id="epilot-sdk">Epilot SDK</h4>

<p>All public epilot services are available through an epilot-sdk (written in JS/TS) that allows developers to interact with epilot APIs. Internally as well, the recommended way to use the services or APIs using directly the SDK instead of going the granular way.</p>

<p>For e.g.,</p>

<div class="language-plaintext highlighter-rouge"><div class="highlight"><pre class="highlight"><code>import { getClient } from 'epilot-sdk/entity-client'
</code></pre></div></div>

<p>Want to scratch your itch? Find it here:</p>

<p><a href="https://www.npmjs.com/package/@epilot/epilot-sdk"><strong>@epilot/epilot-sdk</strong></a></p>

<h4 id="communicating-between-microfrontends">Communicating between microfrontends</h4>

<p>One of the interesting challenges I recently faced was to communicate between two applications without any shared library. One was the sidebar built using Svelte and another the topbar built with React. Now we usually tend to avoid any such communication between our MFEs but this was a state clear event to happen before a routing change in any of the two MFEs.</p>

<p>I used single-spa’s custom events to do this. The idea was to clear the selected state of an icon in the topbar when an icon in the sidebar was selected, and vice versa.<br />
To do this, I used the <code class="language-plaintext highlighter-rouge">single-spa:before-routing-event</code> custom event to check if the active URL in the current application was undefined, we could clear the state, if however, the URL existed, that becomes the active state. <br />
Checking the URL history without communicating between two applications was not possible due to two separate routers for each application. Svelte app using the <code class="language-plaintext highlighter-rouge">svelte-routing</code> package where with React, the <code class="language-plaintext highlighter-rouge">react-router</code> .</p>

<p><img src="https://unravelweb.dev/wp-content/uploads/2022/10/1tbIakQdOsZdWqMkEuAr3TA.png" alt="" /></p>

<p><a href="https://single-spa.js.org/docs/api/#custom-events">Read more about the single spa custom events here</a>.</p>

<p>Here’s a detailed view of the tech stack used at epilot:</p>

<p><img src="https://unravelweb.dev/wp-content/uploads/2022/10/1V7VGeO-iDvUbnYFgC577mQ.png" alt="" /></p>

<p><a href="https://docs.epilot.io/techradar/">https://docs.epilot.io/techradar/</a></p>

<p>I have shared more info on my journey to epilot as a full-stack developer in my Spotify Podcast here:</p>

<iframe allow="autoplay; clipboard-write; encrypted-media; fullscreen; picture-in-picture" allowfullscreen="" frameborder="0" height="152" src="https://open.spotify.com/embed/episode/2C4KYDkRroA6Uc2QevdhLt?si=ap_yhzZKTuuECCeAc47wCA&amp;utm_source=oembed" style="border-radius: 12px" title="Spotify Embed: #17 Unravelling The Web w/ Nishu Goel" width="100%"></iframe>

<p>Spotify podcast</p>

<p>Interested to know more about how we do things at epilot? Reach out here: <a href="http://twitter.com/@TheNishuGoel">twitter.com/@TheNishuGoel</a></p>]]></content><author><name></name></author><category term="Javascript" /><category term="javascript" /><category term="job" /><category term="react" /><summary type="html"><![CDATA[Year 2022 marked an amazing start for me with a new stint with epilot GmbH based out of Cologne, Germany. I joined the team to be working on their micro-frontend architecture, with my primary focus going to be on the performance aspects of the applications.  Like the first recent addition we did after I started was to add brotli compression to each of our micro-frontend (MFEs) bundles.]]></summary></entry><entry><title type="html">catching up!</title><link href="https://unravelweb.dev/catching-up/" rel="alternate" type="text/html" title="catching up!" /><published>2021-12-19T00:00:00+00:00</published><updated>2021-12-19T00:00:00+00:00</updated><id>https://unravelweb.dev/catching-up</id><content type="html" xml:base="https://unravelweb.dev/catching-up/"><![CDATA[<p>hi folks!<br />
This post comes after 4 months and I am grateful to my almost 1K Medium followers who still read my posts.<br />
The past months were quite a ride with all the work that I was busy with. Did you say, “but you weren’t writing!”? I was! Just not here on my personal medium blog.</p>

<p>So I took up a bigger challenge for myself (yes, open-source, of course) and with a better read for y’all. Yes, it’s a lot of content.</p>

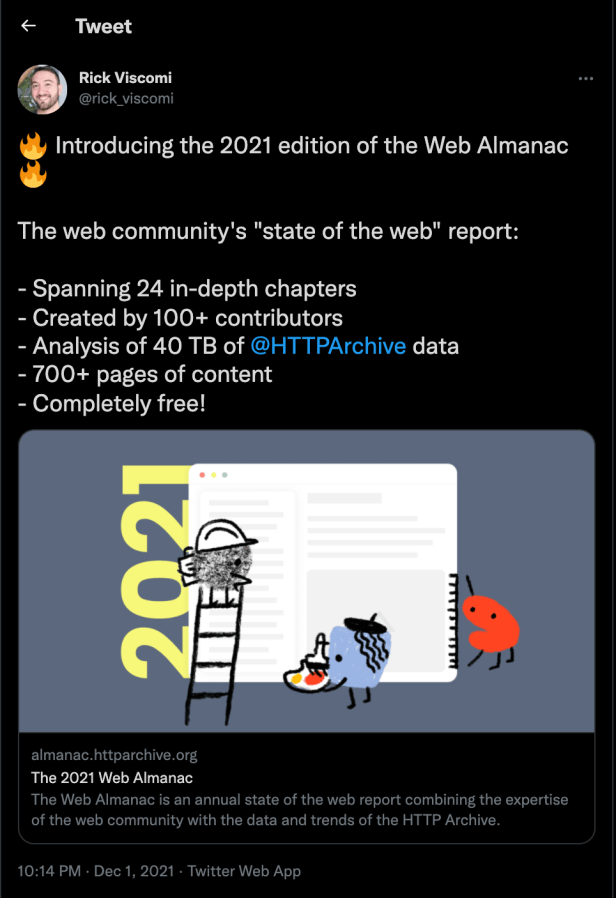
<p>So, I authored the <a href="https://almanac.httparchive.org/en/2021/javascript"><strong>JavaScript chapter for the Web Almanac 2021</strong></a>. To keep you up to speed, <a href="https://almanac.httparchive.org/en/2021/">The Web Almanac</a> is:</p>

<blockquote>
  <p>HTTP Archive’s annual state of the web report that combines the raw stats and trends of the HTTP Archive. It is backed by real data and trusted web experts. The 2021 edition is comprised of 24 chapters spanning aspects of page content, user experience, publishing, and distribution.</p>
</blockquote>

<p>In simple terms, it shares a lot of statistics around what is being used, adopted, preferred on the web by the developer community. How are the features being used and if the way they are used, serve the sole idea of the introduction of that feature.</p>

<p>My participation started while I was exploring GitHub activities, and ended up coming across at the <a href="https://github.com/HTTPArchive/almanac.httparchive.org/issues/2141">Http Archive’s JavaScript repo for 2021</a>. I volunteered to author the chapter but ended up becoming the content team lead whose responsibility was not just analysing the data from the <a href="https://almanac.httparchive.org/en/2021/methodology#websites"><strong>8 million websites</strong></a> crawled and writing about it, BUT many other steps.</p>

<p>I’ll be honest that I was overwhelmed with the amount of work to do and get the chapter in its shape, but it was challenging and basically, lots of data (power)!</p>

<p>The phases (starting June 2021) in the complete chapter building involved:</p>

<ol>
  <li>Planning the content and preparing an outline.</li>
  <li>Gathering the data and writing <a href="https://github.com/HTTPArchive/legacy.httparchive.org/blob/master/custom_metrics/javascript.js">custom metrics</a> (in JavaScript). These were run during the crawl after the page was rendered in the browser.</li>
  <li>July 1–31 is when the crawl took place.</li>
  <li>Next was to analyse, <a href="https://github.com/HTTPArchive/almanac.httparchive.org/tree/main/sql/2021/javascript">query the data</a> and save <a href="https://docs.google.com/spreadsheets/d/1zU9rHpI3nC6jTz3xgN6w13afW7x34xAKBh2IPH-lVxk/edit?usp=sharing">the results to a sheet</a> which is the source of truth for all the content in the chapter. This step also involved ensuring that our custom metrics ran properly and output was expected (I have an interesting anecdote to share about this later).</li>
  <li>Now started the draft writing phase based on the understanding formed after the data output. This was, as it seems, the most involving task in the whole process. Not only because there was loads to write but also because, you need to analyse as to why, for example, there is increase/decrease in the usage of one particular JavaScript feature.</li>
  <li>Nope, doesn’t end there. This is where the review process starts where your reviewers help you frame sentences better for a common and easy understanding. They help you with forming the overall chapter better both content and usage wise.</li>
  <li>Editing — This step was more about language improvements and obvious mistakes that should be removed.</li>
  <li>To the moon. 🚀</li>
</ol>

<p>In the next few paragraphs, I will share about the learnings and challenges at each step. The purpose of doing this is 1) to reflect how helpful and growing of an experience this was personally, 2) to help anybody who is considering writing the chapter in the coming years, 3) to point you the great resource (all JavaScript and more), if you haven’t already come across this ocean of information.</p>

<ul>
  <li>The outline planning stage was super fun, full of research where we were all creative and thinking of putting in the best possible statistics and information. This involved the <a href="https://github.com/tc39/proposals/blob/master/finished-proposals.md">newer JavaScript features based on the TC39 finished proposals</a> to the community. My fellow contributors helped me in the process of preparing the outline and brainstorming the content. <a href="https://twitter.com/pankajparkar">Pankaj Parkar</a> was very helpful in this step suggesting ideas and possibilities.</li>
  <li>Writing custom metrics was based on the author’s understanding of what they plan to deliver through the chapter and what is the data that they need from the websites to showcase that. This involved thinking ahead on all what could be available from running queries on data, or something that needed to be captured after the page render.</li>
</ul>

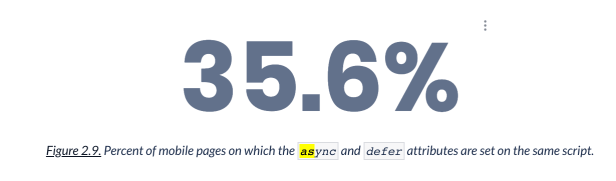
<p>For example, To check if the script tags use the async/defer attribute, there were two ways — 1) check initial page and look for scripts with these attributes — This did not require running a custom metric and could be simply attained by running a query on summary response table in the database.<br />
2) To write a custom metric to get the no. of script tags with async or defer attribute and then run a query to get this percentage.</p>

<p><a href="https://github.com/HTTPArchive/legacy.httparchive.org/blob/master/custom_metrics/javascript.js#L62">https://github.com/HTTPArchive/legacy.httparchive.org/blob/master/custom_metrics/javascript.js#L62</a></p>

<p><a href="https://almanac.httparchive.org/en/2021/javascript#async-and-defer">The results were different from each other.</a> You’d wonder why:</p>

<blockquote>
  <p>“This difference shows that many pages update these attributes dynamically after the document has already been loaded. For example, one website was found to include the following script….”</p>
</blockquote>

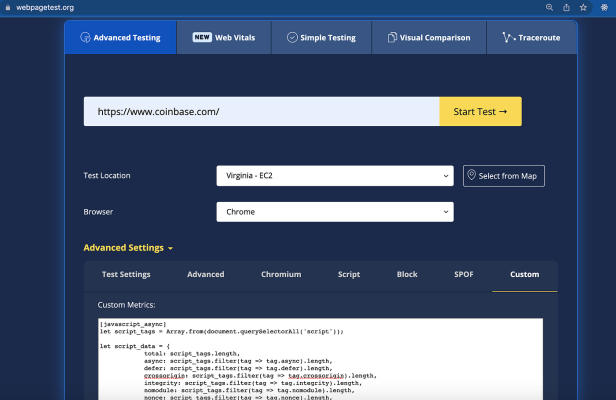
<p>We used <a href="https://webpagetest.org/"><strong>web page test</strong></a> to run our custom metrics and ensure that’s what we are looking for from the crawl.</p>

<p>For example:</p>

<p><img src="/assets/img/2634b1-1_4uNrZLPn3vmTBQXmPyQPQA.png" alt="" /></p>

<p>WebPageTest to run our script tag custom metric</p>

<p>One challenge faced with the custom metrics was specifically with the web component custom metric where we made a <a href="https://github.com/HTTPArchive/legacy.httparchive.org/pull/231">mistake in the code ending up not getting correct results from the July Crawl. We fixed this for the next crawl</a> and the results in the chapter were, thus, delivered from the September crawl for this particular statistic.</p>

<p>See the note here:</p>

<p><a href="https://github.com/HTTPArchive/almanac.httparchive.org/blob/main/sql/2021/javascript/web_components_specs.sql">https://github.com/HTTPArchive/almanac.httparchive.org/blob/main/sql/2021/javascript/web_components_specs.sql</a></p>

<ul>
  <li>The next was analysing the crawl data. The queries were supposed to be written using BigQuery which was a good learning activity. We wrote the queries and saved the output to the result sheet. The analysts helped us with saving the data and creating the visuals for that. All the interactive charts and statistics.</li>
</ul>

<p>Following queries were used to gather the data for the chapter.</p>

<p><a href="https://github.com/HTTPArchive/almanac.httparchive.org/tree/main/sql/2021/javascript">https://github.com/HTTPArchive/almanac.httparchive.org/tree/main/sql/2021/javascript</a></p>

<p>The charts created from the query data were published both interactively and as images. Finally wrote the chapter in a doc, converted to markdown, added the figures to the chapter in a render-able format.</p>

<p><a href="https://github.com/HTTPArchive/almanac.httparchive.org/blob/main/src/content/en/2021/javascript.md">https://github.com/HTTPArchive/almanac.httparchive.org/blob/main/src/content/en/2021/javascript.md</a></p>

<p>The conversion of visuals to a format that adds caption, description, and interactive charts was definitely a lot of task after the writing the chapter but definitely worth it.</p>

<p><a href="https://almanac.httparchive.org/en/2021/javascript#javascript-requests-per-page">https://almanac.httparchive.org/en/2021/javascript#javascript-requests-per-page</a></p>

<p><a href="https://twitter.com/rick_viscomi/status/1466085711396933634">The chapter finally launched on December 1</a>after all the reviews, edits added, accommodated, and this definitely felt like an achievement.</p>

<p><img src="/assets/img/799d23-1_2EgA1l_NfYs_BFOn2VwSQw.png" alt="" /></p>

<p>The chapter was welcomed very well and got a lot of people talking. Especially with the following statistic which show the usage of jQuery still at 80%.</p>

<p><img src="/assets/img/bebc1b-0_GK8v9_-CIKXrgNAq.png" alt="" /></p>

<p>Credits: <a href="https://almanac.httparchive.org/static/images/2021/javascript/js-libs-frameworks.png">https://almanac.httparchive.org/static/images/2021/javascript/js-libs-frameworks.png</a></p>

<p>And the usage of async/defer statistic: <br />
<a href="https://docs.google.com/spreadsheets/d/1zU9rHpI3nC6jTz3xgN6w13afW7x34xAKBh2IPH-lVxk/edit#gid=2038121216">JavaScript (Web Almanac 2021)Pages using async/ defer / neither</a></p>

<p><img src="/assets/img/40ef86-1_uoLSsudgLWe0u9ZDr7Iiew.png" alt="" /></p>

<p>Credits: <a href="https://docs.google.com/spreadsheets/d/1zU9rHpI3nC6jTz3xgN6w13afW7x34xAKBh2IPH-lVxk/edit#gid=2038121216">https://docs.google.com/spreadsheets/d/1zU9rHpI3nC6jTz3xgN6w13afW7x34xAKBh2IPH-lVxk/edit#gid=2038121216</a></p>

<p>In the first week of publishing, it became the most popular chapter of the Web Almanac with more than 2K views already. You can view the 2021 Web Almanac analytics here:</p>

<p><a href="https://datastudio.google.com/s/gNBIUwcc8LE">https://datastudio.google.com/s/gNBIUwcc8LE</a></p>

<p><img src="/assets/img/e80994-1_kdBKCRL5rfg19caMSXphhQ.png" alt="" /></p>

<p>Some amazing statistics about this year’s Web Almanac are:</p>

<p><a href="https://github.com/HTTPArchive/almanac.httparchive.org/issues/2167">7</a> <a href="https://github.com/HTTPArchive/almanac.httparchive.org/issues/2167">months of work</a><br />
<a href="https://github.com/HTTPArchive/almanac.httparchive.org/tree/main/sql/2021">736 queries and 48,218 lines of SQL</a><br />
<a href="https://almanac.httparchive.org/en/2021/table-of-contents">24 chapters</a><br />
<a href="https://almanac.httparchive.org/en/2021/contributors">112 contributors</a><br />
<a href="https://almanac.httparchive.org/en/2021/methodology">8M websites tested and 40 TB of data analysed</a><br />
<a href="https://almanac.httparchive.org/static/pdfs/web_almanac_2021_en.pdf">Over 700 pages when saved to PDF</a></p>

<p>You can download this as an <a href="https://almanac.httparchive.org/static/pdfs/web_almanac_2021_en.pdf"><strong>ebook</strong></a> too.</p>

<p>You can already sign up to contribute to the next year’s report here. This could be as an author, reviewer, editor, and/or as an analyst.</p>

<p><a href="https://forms.gle/Bb2ZZj6Yw5RnJHbj8">https://forms.gle/Bb2ZZj6Yw5RnJHbj8</a></p>

<p>This is about what I was doing the past 4 months and what comes next is more detailed blog posts from me on the Web in general.</p>

<p><a href="https://twitter.com/TheNishuGoel">Follow me on Twitter</a> for more details and staying up-to-date.<br />
OR<br />
If you are not a Medium fan (maybe because of the paywall, or because of the hassle of going to incognito to open my posts),<br />
I have all the content also served on <a href="https://unravelweb.dev/">my personal website</a>, which is absolutely free, no paywall, no ads.</p>

<p><a href="https://unravelweb.dev/">https://unravelweb.dev/</a></p>

<h1 id="thank-you">Thank you!</h1>]]></content><author><name></name></author><category term="Code" /><category term="JavaScript" /><category term="Programming" /><category term="Web" /><category term="engineering" /><category term="javascript" /><category term="performance" /><category term="tech" /><category term="technology" /><category term="web" /><summary type="html"><![CDATA[hi folks! This post comes after 4 months and I am grateful to my almost 1K Medium followers who still read my posts. The past months were quite a ride with all the work that I was busy with. Did you say, “but you weren’t writing!”? I was! Just not here on my personal medium blog.]]></summary></entry><entry><title type="html">interesting JavaScript metrics?</title><link href="https://unravelweb.dev/interesting-javascript-metrics/" rel="alternate" type="text/html" title="interesting JavaScript metrics?" /><published>2021-06-04T00:00:00+00:00</published><updated>2021-06-04T00:00:00+00:00</updated><id>https://unravelweb.dev/interesting-javascript-metrics</id><content type="html" xml:base="https://unravelweb.dev/interesting-javascript-metrics/"><![CDATA[<h5 id="suggestions-welcome">Suggestions welcome,</h5>

<p>For the #javascript 2021 chapter of web-almanac, I’d like to know from the #javascript developers here if you’d be interested to see any special metrics in the report?</p>

<p>Metrics like: I, as an Angular dev, would be very interested to know how many applications use SSR or as a JavaScript dev, what differential loading method is used in majority JS apps.</p>

<p>No clue what I am talking about? Refer to this and share your thoughts:</p>

<p><a href="https://github.com/HTTPArchive/almanac.httparchive.org/issues/2141">https://github.com/HTTPArchive/almanac.httparchive.org/issues/2141</a></p>

<p>Do let me know in the comments.</p>]]></content><author><name></name></author><category term="Articles" /><category term="Code" /><category term="JavaScript" /><category term="Web" /><category term="community" /><category term="http" /><category term="javascript" /><category term="web" /><summary type="html"><![CDATA[Suggestions welcome,]]></summary></entry><entry><title type="html">Attend Reliable Web Summit</title><link href="https://unravelweb.dev/attend-reliable-web-summit/" rel="alternate" type="text/html" title="Attend Reliable Web Summit" /><published>2021-06-02T00:00:00+00:00</published><updated>2021-06-02T00:00:00+00:00</updated><id>https://unravelweb.dev/attend-reliable-web-summit</id><content type="html" xml:base="https://unravelweb.dev/attend-reliable-web-summit/"><![CDATA[<p>Hey everyone,<br />
I’ll be speaking at the <a href="https://reliablewebsummit.com/"><strong>ReliableWebSummit</strong></a> by #ngconf this August.</p>

<p>The conference revolves around Scalable infrastructure and architecture, Maintainable Code, Automated Testing etc.</p>

<p>Would like to be a part?<br />
Use my speaker code <strong>“Speaker”</strong>to get 50% off of the current ticket prices or simply click <a href="https://reliablewebsummit.us7.list-manage.com/track/click?u=e45fd510f70a16fd9f7797276&amp;id=216679f3de&amp;e=ec5bd8cb76"><strong>this</strong></a> link.</p>

<p><em>Date: August 26–27, 2021</em></p>

<p>See you there 🙂</p>]]></content><author><name></name></author><category term="Code" /><category term="Programming" /><category term="Speaking" /><category term="community" /><category term="conference" /><category term="tech" /><category term="web" /><summary type="html"><![CDATA[Hey everyone, I’ll be speaking at the ReliableWebSummit by #ngconf this August.]]></summary></entry></feed>